


 Crypto Major Pair Action Bias: ETHUSD Bullish as BTCUSD, SOLUSD & XRPUSD Stay Neutral
  Gold Loses Steam After Strong U.S. Retail Sales
  FxWirePro: GBP/NZD gains some upside momentum but still bearish
  FxWirePro- Major Crypto levels and bias summary
  FxWirePro- Major Pair levels and bias summary
  FxWirePro: USD/JPY uptrend loses steam, remains on bullish path
  FxWirePro:EUR/NZD dips below lower range, bearish bias increases
  ETH Stands Alone Bullish; BTC, SOL, XRP, BNB Neutral
  FxWirePro: GBP/NZD downtrend loses steam, remains on bearish path
  FxWirePro: GBP/USD under pressure despite UK's modest economic growth
  FxWirePro: EUR/AUD neutral in the near term, scope for downward resumption


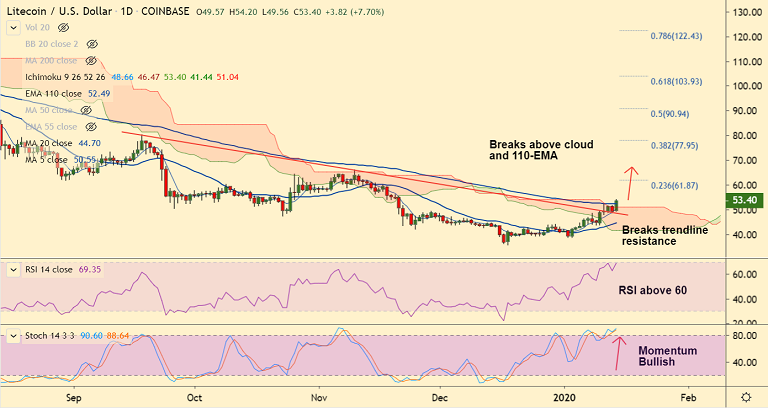
LTC/USD chart - Trading View
Exchange - Coinbase
Technical Analysis: Bias Bullish
GMMA Indicator: Major Trend - Turning slightly bullish; Minor Trend - Strongly bullish
Overbought/ Oversold Index: Overbought
Volatility: Rising
Support: 52.49 (110-EMA); Resistance: 54.37 (20W MA)
LTC/USD was trading 7.91% higher on the day at 53.50 at 07:00 GMT, bias has turned bullish.
The pair closed 3.58% lower on Monday's trade, but has gained upside momentum on the day, tracking BTC higher.
Price action has broken past major resistance levels - 48.75 (trendline), 51.04 (cloud top) and 52.49 (110-EMA).
Volatility is rising and GMMA shows bullish shift in the near-term trend. Technical indicators are also bias higher. Scope for continuation on upside momentum.
The pair finds major resistance at 20W MA at 54.37. Close above raises scope for test of 23.6% Fib at 61.87 ahead of 200-DMA at 66.42.
Failure at 20W MA will likely see sideways grind. Retrace below 21-EMA will negate any bullish bias.


