


 FxWirePro- Woodies pivot (Major)
  FxWirePro- Major Crypto levels and bias summary
  EUR/USD Holds Bullish Tone Despite Pullback from Yesterday’s High
  ETH Stands Alone Bullish; BTC, SOL, XRP, BNB Neutral
  JPY Action Bias: Extremely Bullish Surge Ignites Across NZD, GBP & AUD
  FxWirePro:EUR/NZD stuck In narrow ranges, focus on near term support
  FxWirePro:EUR/NZD dips below lower range, bearish bias increases
  FxWirePro: GBP/NZD downtrend loses steam, remains on bearish path


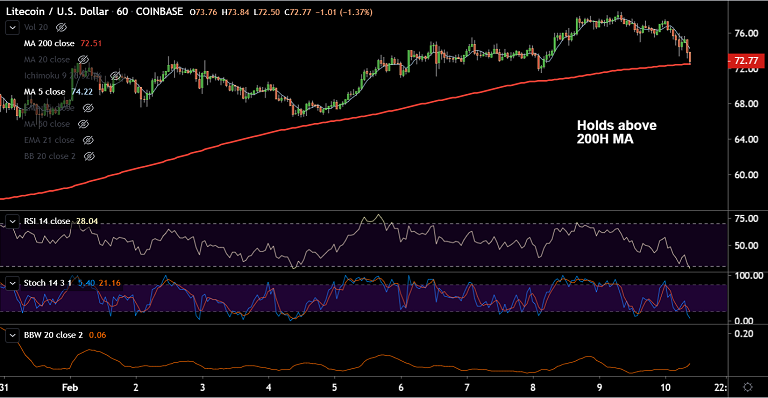
LTC/USD chart - Trading View
Exchange - Coinbase
Technical Analysis: Bias Bullish
GMMA Indicator: Major Trend - Bullish; Minor Trend - Bullish
Overbought/ Oversold Index: Overbought
Volatility: High
Support: 72.50 (200H MA); Resistance: 75.07 (5-DMA)
LTC/USD has paused upside with a Doji formation on the previous session's candle.
The pair was trading 5.87% lower on the day at 72.53 at around 09:30 GMT, bias turning slightly bearish.
Oscillators are at oversold levels and on verge of rollover into neutral. Price action has slipped below 5-DMA support.
200H MA is strong support at 72.50. Break below will see dip till 67.00 (21-EMA). Bullish invalidation only below 200-DMA.
On the flipside, resumption of upside will see major resistance at weekly cloud at 84.09.


