


 FxWirePro: AUD/USD edges lower, but bullish outlook persists
  Crypto Major Pair Action Bias: ETHUSD Bullish as BTCUSD, SOLUSD & XRPUSD Stay Neutral
  EUR/USD Holds Bullish Tone Despite Pullback from Yesterday’s High
  AUDJPY Bullish Surge: Strong Australian Dollar Fuels Fresh Upside as Pair Holds Above 113.50 and All EMAs Align
  FxWirePro: GBP/NZD gains some upside momentum but still bearish
  JPY Action Bias: Extremely Bullish Surge Ignites Across NZD, GBP & AUD
  ETH Stands Alone Bullish; BTC, SOL, XRP, BNB Neutral
  FxWirePro: NZD/USD trades in narrow range ,outlook bullish
  FxWirePro:EUR/NZD dips below lower range, bearish bias increases
  FxWirePro- Major Crypto levels and bias summary


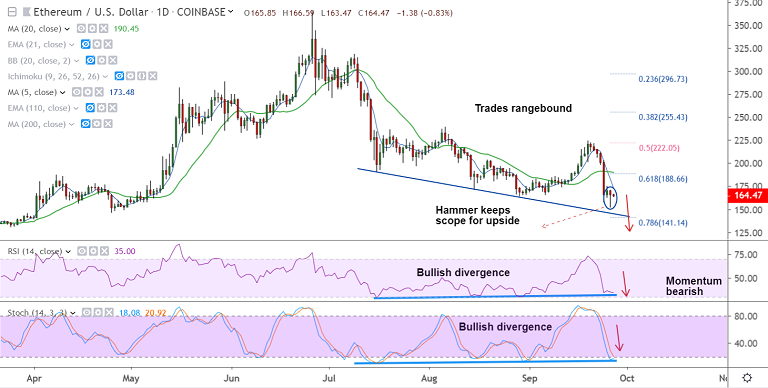
ETH/USD chart - Trading View
Exchange - Coinbase
Support: 144.65 (Trendline); Resistance: 173.56 (5-DMA)
Technical Analysis: Bias Bearish
ETH/USD is trading in an extremely narrow range with session highs at 166.59 and lows at 163.47.
The pair retraced from 5-month lows at 152.11 to close at 165.85 on Thursday's trade.
A 'Hammer' pattern formed on the previous day's candle keeps scope for more recovery in the pair.
Further, the occurrence of bullish divergence on RSI and Stochs raises chances of upside.
No signs of upside yet on the intraday charts. Price grinds sideways along 21-EMA on the hourly charts.
Break above 21H EMA (165.55) finds next hurdle at 5-DMA at 173.49. Break above 5-DMA could see further gains.


