


 FxWirePro- Major Crypto levels and bias summary
  FxWirePro: AUD/USD remains buoyant, looks to extend gains
  FxWirePro :USD/JPY bulls loosen their grip a bit, dips to be bought
  FxWirePro: EUR/AUD bears maintain upper hand
  NZDJPY Bullish Surge: Strong Kiwi Ignites Fresh Upside as 94 Support Holds and All EMAs Align
  FxWirePro: NZD/USD trades in narrow range ,outlook bullish
  GBPJPY Bullish on Consolidation: Holds Above 216 After 218 Top – Buy Dips at 217 Targeting 220
  ETHUSD Bullish Momentum: Follows BTC Above All EMAs, Buy Dips Near $1750 Targeting $2300
  Crypto Major Pair Action Bias: ETHUSD Bullish as BTCUSD, SOLUSD & XRPUSD Stay Neutral
  FxWirePro: GBP/NZD downtrend slows, but bearish sentiment remains


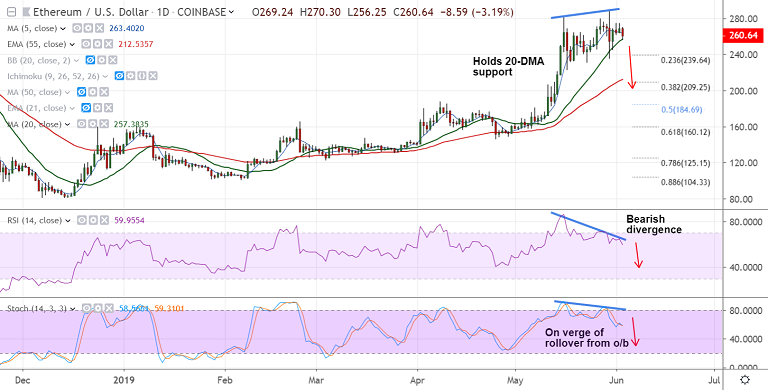
ETH/USD chart - Trading View
Exchange - Coinbase
Support: 248.03 (21-EMA); Resistance: 278.72 (Upper BB)
Technical Analysis: Bias Neutral to slightly bearish
ETH/USD extends sideways grind along 5-DMA support. Doji formation on previous weeks' candle keep upside limited.
Volatility is shrinking on the daily charts, scope for further consolidation.
The pair is trading 3.1% lower on the day at 260.88 at 08:55 GMT.
Price action is holding support at 20-DMA, break below will see further weakness.
Stochs and RSI have turned bearish and are showing a 'bearish divergence' from price action.
Break below 20-DMA finds next major support at 21-EMA at 247.96 ahead of 23.6% Fib at 236.64.
For details on FxWirePro's Currency Strength Index, visit http://www.fxwirepro.com/currencyindex.


