


 FxWirePro- Major Pair levels and bias summary
  Crypto Major Pair Action Bias: ETHUSD Bullish as BTCUSD, SOLUSD & XRPUSD Stay Neutral
  FxWirePro: NZD/USD trades in narrow range ,outlook bullish
  FxWirePro: GBP/USD under pressure despite UK's modest economic growth
  FxWirePro- Major Crypto levels and bias summary
  ETH Stands Alone Bullish; BTC, SOL, XRP, BNB Neutral
  FxWirePro- Major Pair levels and bias summary


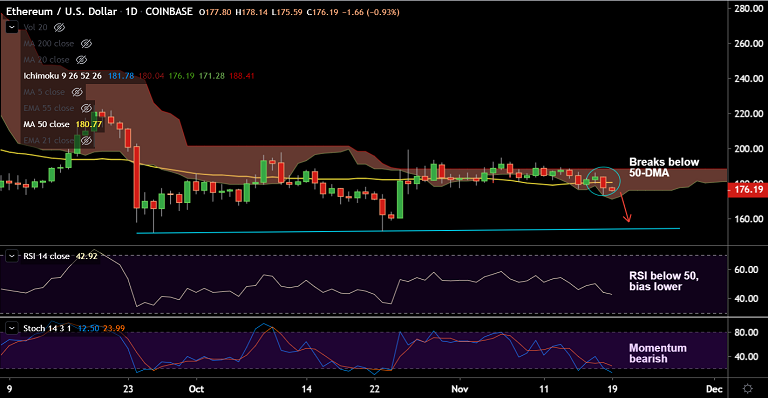
ETH/USD chart - Trading View
Exchange - Coinbase
Support: 171.28 (Cloud base); Resistance: 180.77 (50-DMA)
Technical Analysis: Bias turning bearish
ETH/USD has ended the consolidation phase, bias has turned bearish.
The pair was trading 0.96% lower at 176.10 at 06:45 GMT after closing 3.28% lower in the previous session.
Price action is extending break below 50-DMA support and rising volatility raises scope for further weakness.
Technical studies are strongly bearish, Stochs and RSI are biased lower and RSI has fallen below 50 mark.
Major trend is flat, however, near-term trend has shifted to bearish as shown by the GMMA indicator.
Next major support lies at 155 (Lower W BB). Immediate resistance lies at 5-DMA at 179.97. Break above 110-EMA (190.31) will negate near-term bearish bias.


