


 FxWirePro- Major Crypto levels and bias summary
  FxWirePro: USD/JPY slips as yen firms after hot Japan's wholesale inflation data
  FxWirePro: USD/CNY sees some bounce after yesterday's fall
  FxWirePro: GBP/AUD struggle to extend its recovery, good to sell on rally
  FxWirePro- Major Pair levels and bias summary
  NZDJPY Consolidates, Resistance at 90.78 May Signal Favorability for Downtrend
  FxWirePro: EUR/NZD gaining momentum for a move towards 2.0100 level
  FxWirePro: EUR/AUD dips below 1.6200 level ,vulnerable to more downside
  EUR/USD Defies ECB Rate Hike to Reclaim 1.1600: Technical Setup Points to Buy-on-Dips Opportunity


 Add as a preferred source on Google
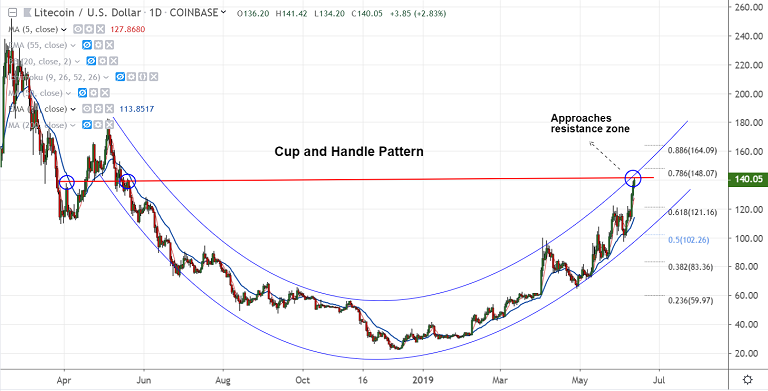
LTC/USD chart - Trading View
Exchange - Coinbase
Support: 127.62 (5-DMA); Resistance: 148.07 (78.6% Fib)
Technical Analysis: Bias Bullish
LTC/USD hits new multi-month highs at 141.42, before paring some gains.
The pair is trading at 139.16 at 03:45 GMT, up 2.20% as we write.
Major trend in the pair is strongly bullish, but signs of correction are strong.
Oscillators have approached overbought conditions and Stochastis RSI is also in the overbought zone.
As the pair extends gains in the 'Cup & Handle' pattern, we see strong resistance at 142 levels.
Also, price action has edged above the Upper Bollinger Band.
Minor correction likely before the next leg higher. Immediate support lies at 5-DMA at 127.62.
Break below 5-DMA could see dip till 21-EMA at 113.79. Bullish invalidation only below 200-DMA.
Resumption of upside will see next bull target at 165 levels.
For details on FxWirePro's Currency Strength Index, visit http://www.fxwirepro.com/currencyindex.







