


 Bernstein Names IAG, Ryanair as Top European Airline Stocks Ahead of Earnings
  Citi Raises TSMC Price Target as AI Chip Demand Strengthens Growth Outlook
  Smartphones are helping filmmakers tell the stories the movie industry overlooks
  Goldman Sachs Says China Competition Weighs More on EU Growth Than Trade Deficit
  Gold Surges Past $4150 on Dovish Fed Signals and Weak Jobs Data; Bullish Outlook Prevails
  Alcohol is one of the most dangerous drugs, yet its presence is ubiquitous in social settings and celebrations
  USA at 250: the Black American struggle for life, liberty and the pursuit of happiness
  Goldman Sachs Raises USD/JPY Forecast, Sees Yen Weakness Persist Through 2027
  JPMorgan Cuts Gold Price Forecast, Sees Bullion Reaching $4,500 by End of 2026
  Buy the Dip: Gold Holds Strong at $3980, Targets $4150


 - EconoTimes)


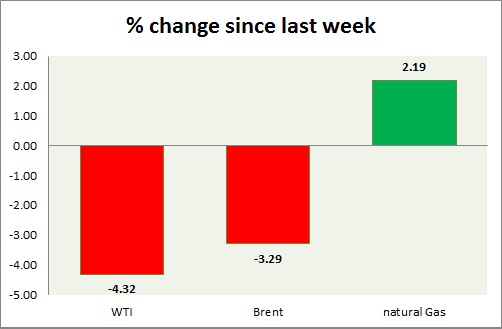
Energy pack is in red today. Weekly performance at a glance in chart & table.
Oil (WTI) -
- WTI marginally down today, testing key level at $50/barrel.
- $54 area proved to be crucial resistance. Today's range $51.3-50.1
- WTI is likely to fall towards $42 area, once $50 support gets broken.
- WTI is currently trading at $50.5/barrel. Immediate support lies at $51.2-50 and resistance at $54
Oil (Brent) -
- Brent is treading water, supported by North Sea outage.
- Brent-WTI spread gained 30 cents today, currently trading at $6.3/barrel.
- Target has reached around $55/barrel, and next target is around $51/barrel.
- Brent is trading at $56.8/barrel. Immediate support lies at $55 area and resistance at $59/60 region.
Natural Gas -
- Natural gas bulls retreated after failing to clear resistance around $2.95/mmbtu area.
- A break above $2.95 area would push prices to first target of $3.1/mmbtu.
- Bullish Doji, in weekly chart remains in focus. However resistance at $2.95 is quite strong.
- Natural Gas is currently trading at $2.85/mmbtu. Immediate support lies at $2.55, $2.45 area & resistance at $2.95, $3.04, $3.32.
|
WTI |
-4.32% |
|
Brent |
-3.29% |
|
Natural Gas |
+2.19% |


