


 AI can be a personal trainer in your pocket – but is it safe?
  Bank of America Upgrades T-Mobile to Buy, Says LEO Satellite Fears Are Overdone
  Bernstein Names IAG, Ryanair as Top European Airline Stocks Ahead of Earnings
  Gold Surges Past $4150 on Dovish Fed Signals and Weak Jobs Data; Bullish Outlook Prevails
  Goldman Sachs Flags 3 Key Risks Ahead of Europe’s Earnings Season
  Buy the Dip: Gold Holds Strong at $3980, Targets $4150
  Goldman Sachs Raises USD/JPY Forecast, Sees Yen Weakness Persist Through 2027
  Smartphones are helping filmmakers tell the stories the movie industry overlooks
  Vietnam’s population hit the 100 million milestone. Where’s it headed?


 - EconoTimes)


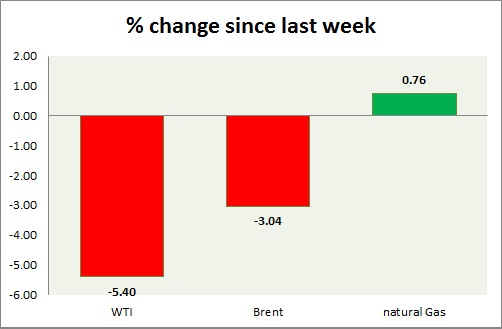
Energy pack is mixed, while oil is flat, gas is in green. Weekly performance at a glance in chart & table.
Oil (WTI) -
- WTI is the worst performer today.
- WTI facing selling pressure around $54 area. Today's range $53.9-51.9
- Target for the downside is reached around $50-51/barrel, a further fall towards $42 seems likely.
- WTI is currently trading at $52.6/barrel. Immediate support lies at $51.2-50 and resistance at $54
Oil (Brent) -
- Brent likely to maintain downside as support near $61 got cleared last week. However eluded Iran deal is providing support to Brent.
- Brent has bounced back from support area of $55, though further drop is likely.
- Brent-WTI spread gained 10 cents today, currently trading at $6/barrel. Spread rose as expected as Iran deal still remained elusive.
- Target is reached around $55/barrel, and next target is around $51/barrel.
- Brent is trading at $58.6/barrel. Immediate support lies at $55 area and resistance at $59 region.
Natural Gas -
- Natural gas bulls pushed higher after price broke to downside.
- Price target for Natural gas to downside is $2.55, $2.45 and $2.35 with stop around $2.85
- Natural Gas is currently trading at $2.79/mmbtu. Immediate support lies at $2.55, $2.45 area & resistance at $2.85, $2.93, $3.04, $3.32.
|
WTI |
-5.40% |
|
Brent |
-3.04% |
|
Natural Gas |
+0.76% |


