


 Wall Street Ends Mixed as Alphabet Slumps, Middle East Developments and Fed Outlook Weigh on Markets
  U.S.-Iran Diplomacy Helps Drive Gasoline Prices Down 15% From May Highs
  Wall Street Slides as AI Stocks Tumble Following South Korea Tech Sell-Off
  Japan Keeps Markets Guessing as Yen Nears 40-Year Low, Raising Intervention Risks
  FxWirePro: Daily Commodity Tracker - 21st March, 2022
  US Dollar Hits One-Year High as Hawkish Fed Outlook Overshadows Middle East Developments
  Oil Prices Slip as Iran Sanctions Relief and Hormuz Shipping Recovery Ease Supply Concerns
  Bessent Says U.S. Must Strengthen Supply Chains and Economic Security
  Gold Prices Mixed as Stronger Dollar Offsets Safe-Haven Demand Amid U.S.-Iran Peace Talks


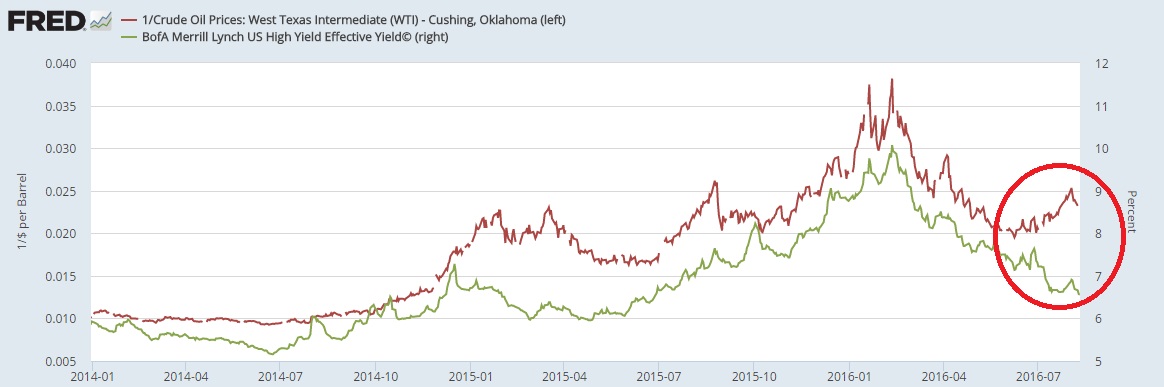
This chart made by us at FxWirePro, in St. Louis Fed's economic dashboard shows how the U.S. high yield bonds have gotten along with the crude oil price (inverse scale). How many barrels of crude a dollar buys vs. Effective yield calculated by Bank of America Merrill Lynch (BofAML).
Since 2015, they had have shown a very high level of intimacy, Crude went down, the yield went up. Both recovered since February.
However, recently these two, have diverged. the oil price edged lower but yields edged lower too. We wonder if the oil doesn't affect the financial position of the high yield companies anymore, the worst is over or is that the investors don't care? Just being crazy about the yield/return? And there will be no credit risk since the money printing is forever!!!


