


 FxWirePro- Major Crypto levels and bias summary
  Bitcoin Holds Above $65K as Institutional Inflows Resume; Buy Dips Near $64K
  AUDJPY Pulls Back on Profit Booking: Buy Dips Toward 117/118
  FxWirePro: GBP/USD slips as Middle East tensions boost safe-haven dollar
  GBPJPY Weakens on Soft UK CPI: Sell Below 217.80 Targeting 216.40
  Major Crypto Action Bias: ETHUSD Turns Bullish – Only Bullish Pair to Watch
  ETHUSD Breaks Above $1900 as Bulls Eye $2300 and Beyond
  NZDJPY Pulls Back on Kiwi Weakness: Buy Dips at 94.40 Targeting 97
  ETH Stands Alone Bullish; BTC, SOL, XRP, BNB Neutral
  Major Crypto Action Bias: BTC, ETH & SOL Turn Bullish – SOLUSD Leads as the Top Pair to Watch


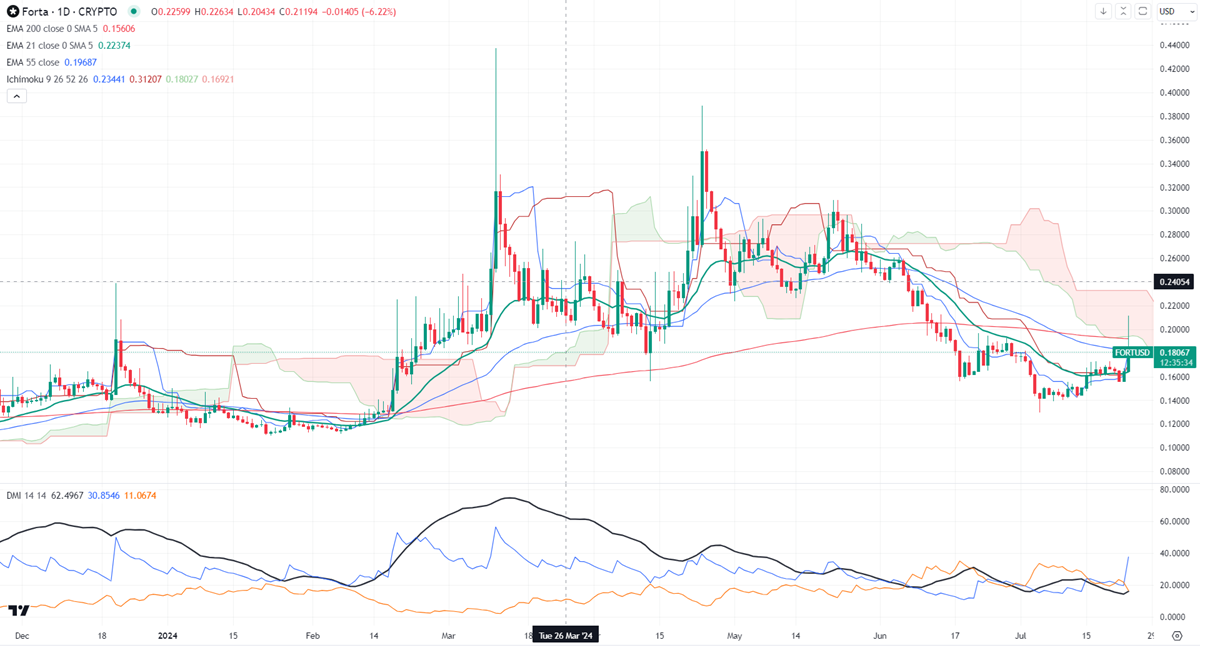
Ichimoku Analysis (4-hour chart)
Tenken-Sen- 0.18353
Kijun-Sen- 0.18353
FORTUSD surged more than 60% after a massive sell-off.
Any daily close above $0.220 confirms further bullishness.
FORTUSD has gained more than 65% in the past two weeks. The pair holds above the short-term (21 and 55 EMA) and below the long-term moving average in the 4-hour chart. It hit a high of $0.2112 and is currently trading around $4.73.
The bullish invalidation can happen if the pair closes below $0.080. On the lower side, the near-term support is $0.150. Any close below targets $0.12/$0.10.
The pair's near-term resistance is around $0.220. Any breach above confirms minor bullishness. A jump to $0.260/ $0.30/$0.3885 is possible. A surge past $0.40 will take it to $0.50/$0.60.
It is good to buy on dips around $0.150 with SL around $0.10 for TP of $0.50.


