


 Gold Pulls Back After Hitting $4,180 as Geopolitical Risk Sends Crude Higher
  FxWirePro :USD/JPY bulls loosen their grip a bit, dips to be bought
  BTCUSD Bullish Breakout: Clears 800-EMA After Consolidation, Buy Dips Toward $74,900
  ETHUSD Bullish Momentum: Follows BTC Above All EMAs, Buy Dips Near $1750 Targeting $2300
  FxWirePro- Major Pair levels and bias summary
  FxWirePro: GBP/AUD loses momentum but outlook is bullish
  Citi Raises TSMC Price Target as AI Chip Demand Strengthens Growth Outlook
  FxWirePro: USD/CAD falls after BoC rate hold and weak U.S. producer inflation
  FxWirePro: GBP/USD hits one-month high, scope for further upside
  FxWirePro- Major Crypto levels and bias summary
  FxWirePro: AUD/USD edges lower, but bullish outlook persists
  FxWirePro- Major Pair levels and bias summary
  Bank of America Upgrades T-Mobile to Buy, Says LEO Satellite Fears Are Overdone


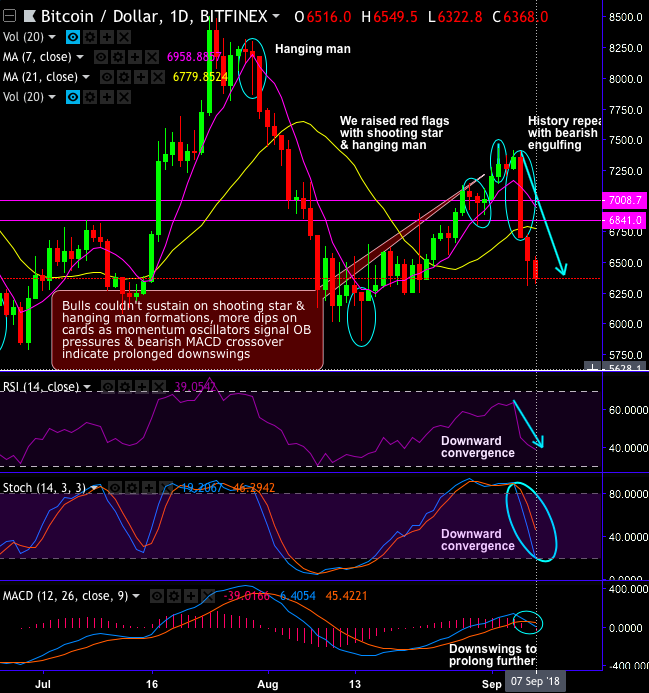
Although bitcoin bulls spiked to the highs of $7,429 levels in the recent past, we had raised cause of concerns owing to the struggling for the convincing bullish momentum on the formations of shooting star and hanging man candlestick patterns.
Please be noted that the bearish streaks of BTCUSD have continued today as well, and the slumps for 3 days consecutively in a row from the peaks of $7,429 levels after shooting star and hanging man patterns at $7,242.40 and $7,300 levels, have taken the current prices well below 21DMAs. Thereby, a solid $1,000 slumps ever since the occurrences of above-stated bearish patterns.
On the intermediate trend perspective, the failure swings were observed exactly at 21EMA levels (refer weekly chart), that is why we used moving averages to optimize the trading strategies, while the major trend wedged between $5,700 – $11,700 levels.
If prices spikes above a moving average it can mostly be contemplated as bullish, as long as prices remain on top and coupled with backing from other indicators such as the Stochastic Oscillator or Relative Strength Index to append to your layers of confirmation.
The outline to moving averages and expedition to empathise the basic concepts begins with the simple moving average, which is computed by taking the mean of a given set of values and plotting it on the chart.
For instance, let’s ponder over a simple 7-day moving average, the closing price of each day is considered, add these values then divide by the number of days, in this case, 7. DMA & MACD bullish crossovers to discover just how much they can improve your bullish trading strategies.
Well, although the bearish sentiments are imminent currently, the bullish potential from here onwards cannot be ruled out. Since it costs about $6,000 to mine a bitcoin and it couldn’t exceed anything lower than that. But the real cause of concern for the short-term traders is that both momentum oscillators (RSI & stochastic curves) signal overbought pressures. Hence, with a view of arresting downside price risks of bitcoin, it is wise to stay short in CME BTC futures contracts for September deliveries, while you are holding the underlying outrights.
Currency Strength Index: FxWirePro's hourly BTC spot index is inching towards -164 levels (which is extremely bearish), while USD is flashing at -79 (which is bearish), while articulating at (11:21 GMT). For more details on the index, please refer below weblink:


