


 2025 Market Outlook: Key January Events to Watch
  S&P 500 Relies on Tech for Growth in Q4 2024, Says Barclays
  FxWirePro: USD/CAD falls after BoC rate hold and weak U.S. producer inflation
  Wizards of the Coast Balances High-Level Play in Final 5th Edition Dungeons & Dragons Campaign
  Standard Chartered’s Investment Arm, SBI Holdings to Set Up Digital Asset Joint Venture in the UAE
  Citi Raises TSMC Price Target as AI Chip Demand Strengthens Growth Outlook
  FxWirePro: USD/JPY uptrend loses steam, remains on bullish path
  Goldman AM Sees Strong Buyout Opportunities in Japan, South Korea and Australia
  Robinhood Announces Plans to Expand Stock-Exchange Application to U.K.
  U.S. Banks Report Strong Q4 Profits Amid Investment Banking Surge
  Bank of America Upgrades T-Mobile to Buy, Says LEO Satellite Fears Are Overdone
  Goldman Sachs Flags 3 Key Risks Ahead of Europe’s Earnings Season
  FxWirePro: EUR/AUD outlook weaker on renewed downside pressure


The month of June has been pathetic for crypto-universe when Coinrail, the South Korean based digital exchange platform, reported a hacking news, as a result, the price of Bitcoin (BTCUSD) plunged by more than 17.8% (as per BITFINEX), but tests strong support at the levels between $5,500 - $6,000 in the recent past. While most of the other major cryptocurrencies are no exception from this bearish streak, which led to the crypto market losing over $42 Billion USD. Consequently, the value of the crypto market dropped below $300 Billion.
Amid continued from trolling on Warren Buffet’s famously comparison of Bitcoin with rat poison to the JPMorgan Chief Mr. Jamie Dimon’s U-turn from his critic statement of cryptocurrency as a fraud, terming digital currencies as a "novelty" and "worth nothing" to his confession after JP Morgan’s keenness of investment into blockchain and crypto-currencies.
On the flip side, another IB giant, Goldman has consistently been constructive on crypto-space, sees Bitcoin "Broadly Heavy.
Well, Bitcoin, the largest cryptocurrency which currently has a market capitalization approximately about $116.07 billion USD, that is about half the size of its total market cap of the industry when it hits all-time highs in mid-January.
However, the recent Bitcoin’s price slumps are predominantly owing to the reaction of BTC to the Asian panic selloff, and especially on the news of the hack on the Korean Exchange; Coinrail which struck the internet last week.
we at EconoTimes would vouch for the fact “be cautious on booming cycles to boost-up long-term bulls’ sentiments”.
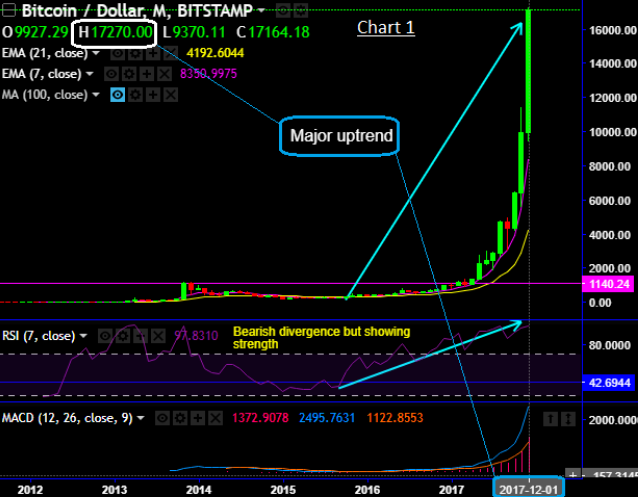
We uphold and substantiate this caution audaciously and absolutely with the historical statistics. Please take a glance through the above shown technical charts that run us through 3 booming cycles:
Well, let’s just plot monthly chart as of the date (refer chart 1), you would arrive with the steep up curve that has begun with a linear curve.
Now, let’s just magnify and then scroll to the left, zoom it and glare at the beginning of the pricing since 2011 for the boom cycle 1, you would probably be amazed by the flat line looking like steeping down from top left to right. That’s when the prices have tumbled from the peaks of $15 to the lows of $2.25 levels or a drop of 566% approx. (Please note that there were boom cycles earlier than this period).
Let’s just visualize, the folks who had involved by then in this asset class during the course of this crash would have interpreted, can’t you see “Bitcoin prices are dying”
Well, maybe yes, but not so soon, let’s proceed with the boom cycle 2 (refer to chart 3):
After surpassing the dollar parity, the crypto that was deemed to be still in R&D stage has again tumbled from the peaks of $259.34 to the lows of $45, leading to the sceptics and another reason to scream “bitcoin is collapsed and no life again”.
The story never stopped here, if you look at the chart 4 that evidences the tumble from the highs of $1,163 to the deep tunnels of $151.68 in the booming cycle 3.
Christopher Matta, a former vice president of investment management division at Goldman Sachs, reckons BTCUSD to hit $15,000 mark.
Dear readers, we reiterate that when an industry or a product that’s newly invented or maybe still under the inception stage, such sort of speculative moves are quite common if you consider the lifecycle. Remember, if this’s the case with any industry or a product, bitcoin has been currency system and it is yet to evolve.
Currency Strength Index: FxWirePro's hourly BTC spot index has shown 160 (which is bullish), while USD is flashing at -108 (bearish) while articulating at 06:03 GMT.
For more details on the index, please refer below weblink:


