


 FxWirePro- Major Crypto levels and bias summary
  FxWirePro:EUR/NZD dips below lower range, bearish bias increases
  FxWirePro: USD/JPY uptrend loses steam, remains on bullish path
  ETH Stands Alone Bullish; BTC, SOL, XRP, BNB Neutral
  Crypto Major Pair Action Bias: ETHUSD Bullish as BTCUSD, SOLUSD & XRPUSD Stay Neutral
  AUDJPY Bullish Surge: Strong Australian Dollar Fuels Fresh Upside as Pair Holds Above 113.50 and All EMAs Align
  FxWirePro: AUD/USD edges lower, but bullish outlook persists
  GBPUSD, AUDUSD & NZDUSD Turn Extremely Bullish: Strong Positive Momentum Drives Major Pair Action Bias
  FxWirePro: GBP/USD hits one-month high, scope for further upside


 Roars Back Above -100 as $100K Rejection Sets Up Explosive Rebound - EconoTimes)


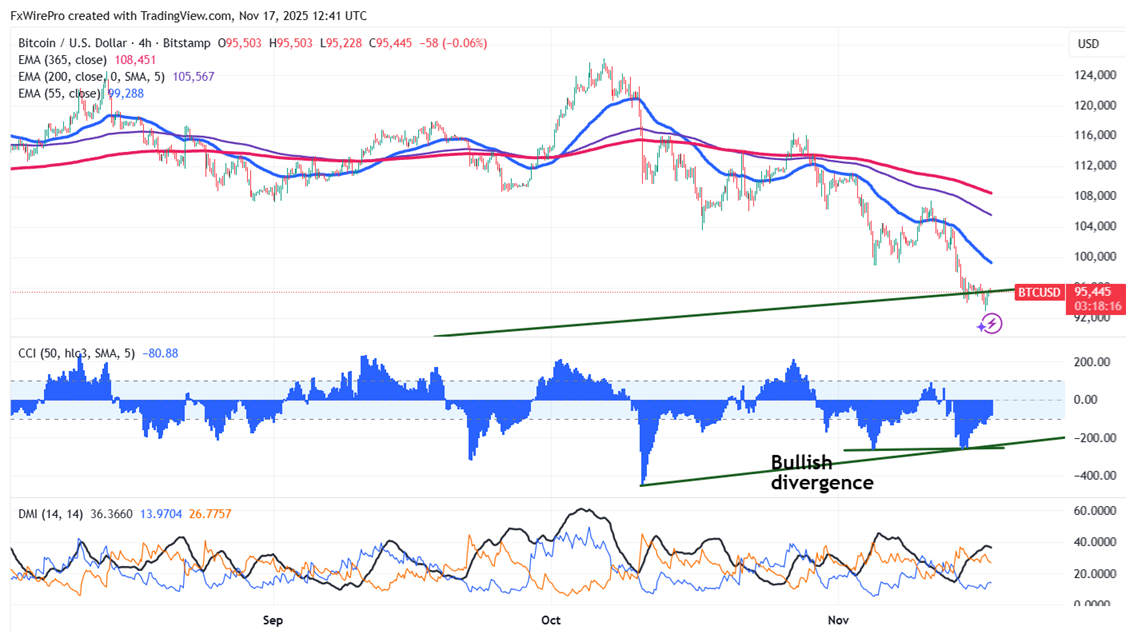
Chart pattern - Bullish divergence in CCI(50)- Both 4-hour and Daily charts.
The CCI line crosses back over the -100 level from the oversold area, confirming that the upward movement is actually taking shape.
Technical Analysis: Key Levels to Watch for BTC/USD
BTC/USD declined sharply below $10000 on weak institutional demand. The pair hits an intraday high of $95938 and is currently trading around $106288.
It trades below short-term (34-EMA and 55-EMA) and long-term (200 and 365-EMA) moving averages on the 4-hour chart. Minor support is around $92800; breaking below this would drag the pair down to $90000/$86500/$80000. Immediate resistance is around $100000 indicates that closing above this level could lead to targets $105900/$108000/$115000/$120000/$126500.
Investment Strategy: Opportunities for Traders
Indicators (4-hour chart).
CCI(50)- Bullish
Directional movement index - Neutral
It is good to buy on dips around $102000 with a stop-loss set at $98000 for a TP of $115000/$120000.


