


 FxWirePro- Major Pair levels and bias summary
  FxWirePro: USD/CAD runs out of steam but maintains bullish outlook
  FxWirePro:EUR/NZD extends decline, key support lies ahead
  FxWirePro: AUD/USD slips on risk aversion as Middle East tensions escalate
  FxWirePro: AUD/USD firms slightly, but downward resumption looks likely
  FxWirePro: EUR/AUD edges higher but outlook still bearish
  FxWirePro: USD/ZAR advances as risk-off sentiment pressures the rand
  AUDJPY Range Traps Bulls: Sell Rallies at 112.60, Target 110


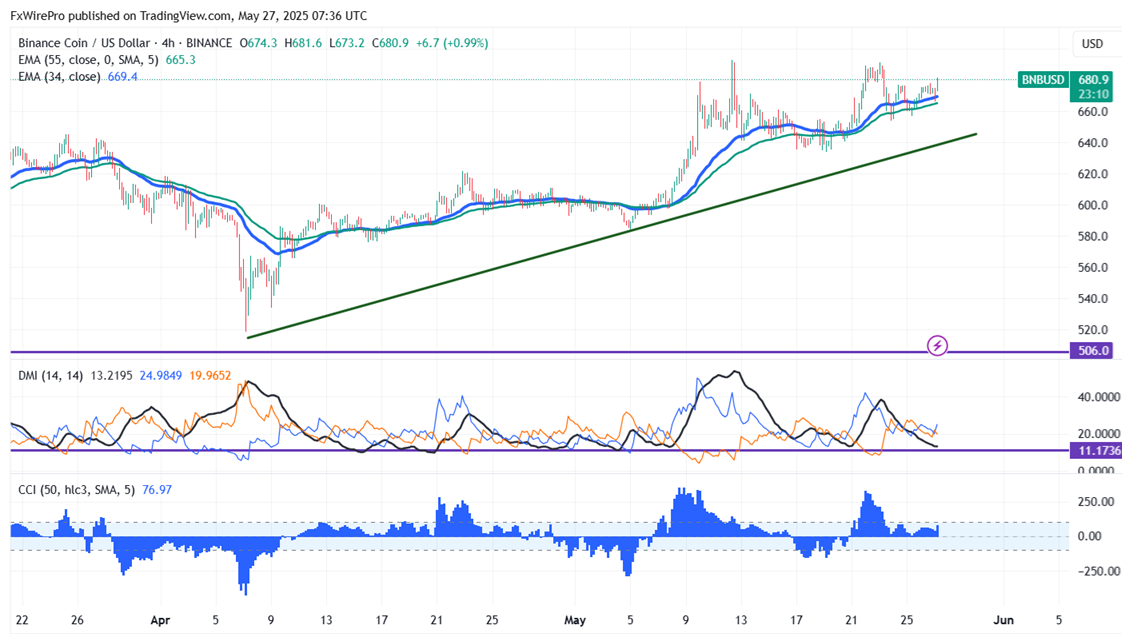
BNB/USD took support near 55- 4 H EMA and showed a minor pullback. It hit an intraday high of $681.60 and is currently trading around $680.70.
Short-term trend remains bullish as long as support $630 holds. It trades above the 55 and 34,200 EMA on the 4-hour chart. Near-term support is around $630, any breach below targets $600/$570/$520. If the pair closes below $500, potentially leading to further declines towards $400.
Immediate Resistance is at $700. A successful breakout above this resistance could suggest bullish momentum, with further gains possible towards $730/$800/$1000.
Indicators (4-Hour Chart)
- Directional Movement Index: Neutral
- CCI (50): Bullish
Trading Strategy
It is good to buy on dips around $665 with a stop-loss set at $630 and a target price of $800/$1000.


