


 FxWirePro- Major Crypto levels and bias summary
  FxWirePro: AUD/USD slips on risk aversion as Middle East tensions escalate
  FxWirePro: NZD/USD dips as geopolitical tensions weighs on Kiwi dollar
  FxWirePro: EUR/AUD edges higher but outlook still bearish
  FxWirePro: USD/ CNY gains some ground but bearish outlook persists
  NZDJPY Bulls Hold the Line: 92.60 Support Fuels Dip-Buy Setup to 95
  EURJPY Bullish Bias Holds Strong: Buy the 184.80 Dip Toward 187
  FxWirePro- Major Crypto levels and bias summary
  Bitcoin Pulls Back as US-Iran Tensions Stir Fresh Risk-Off Pressure
  FxWirePro : USD/JPY holds bullish bias despite intervention concerns
  FxWirePro: USD/ZAR advances as risk-off sentiment pressures the rand
  ETHUSD Bullish Momentum: Follows BTC Above All EMAs, Buy Dips Near $1750 Targeting $2300
  FxWirePro- Major Pair levels and bias summary


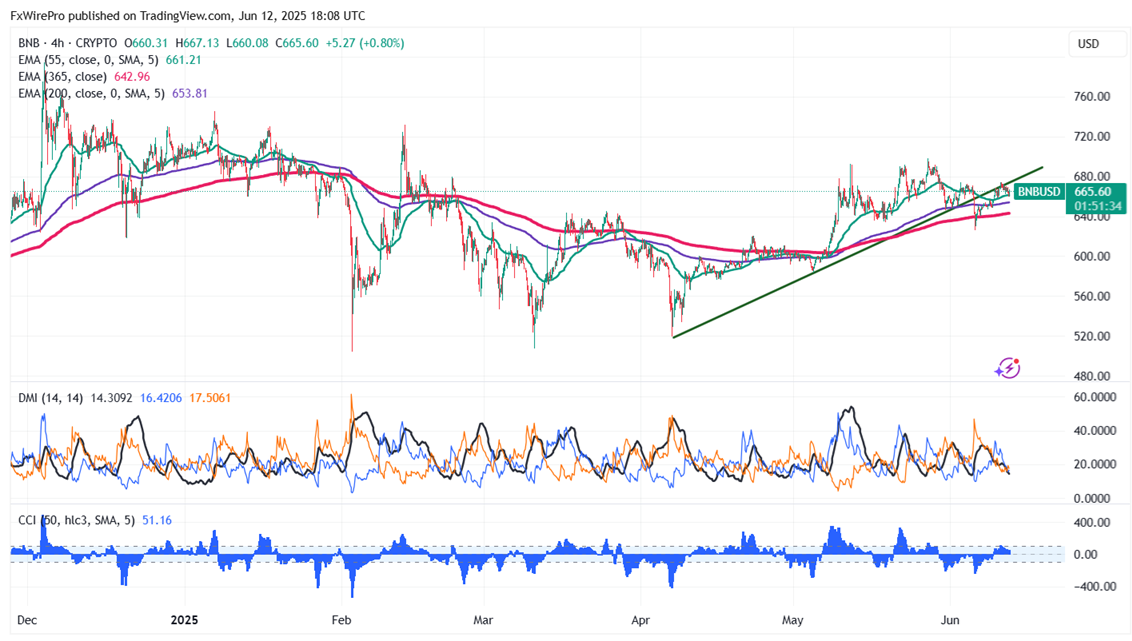
BNB/USD has been consolidating in a narrow range between $674 and $660 for the past two days. It hit an intraday low of $660 and is currently trading around $665.93.
Short-term trend remains bullish as long as support $625 holds. It trades above the 55 and 34,200 EMA on the 4-hour chart. Near-term support is around $640(365- 4H EMA) , any breach below targets $625/$600/$570/$520. If the pair closes below $500, potentially leading to further declines towards $400.
Immediate Resistance is at $700.Any breakout above this resistance confirms bullish momentum and a jump to could suggest bullish momentum, with further gains possible towards $730/$800/$1000. Near-term resistance is around $680.
Indicators (4-Hour Chart)
- Directional Movement Index: Neutral
- CCI (50): Neutral
Trading Strategy
It is good to buy on dips around $650 with a stop-loss set at $600 and a target price of $800/$1000.


