


 FxWirePro- Major Pair levels and bias summary
  FxWirePro- Major Crypto levels and bias summary
  FxWirePro- Woodies pivot (Major)
  FxWirePro: USD/ZAR advances as risk-off sentiment pressures the rand
  EUR/USD Slips Below 1.1380 as US-Iran Tensions Fuel Dollar Demand
  BTCUSD Bullish Breakout: Clears 800-EMA After Consolidation, Buy Dips Toward $74,900
  FxWirePro- Major Crypto levels and bias summary
  GBPJPY Dips to 216.71 On Yen Strength: Buy the 217 Zone Targeting 220
  FxWirePro: USD/JPY slides as yen rallies on Japan pension fund plans
  FxWirePro- Major Pair levels and bias summary
  AUDJPY Range Traps Bulls: Sell Rallies at 112.60, Target 110
  FxWirePro: USD/CAD runs out of steam but maintains bullish outlook
  FxWirePro: GBP/USD weighed down by renewed Middle East attacks


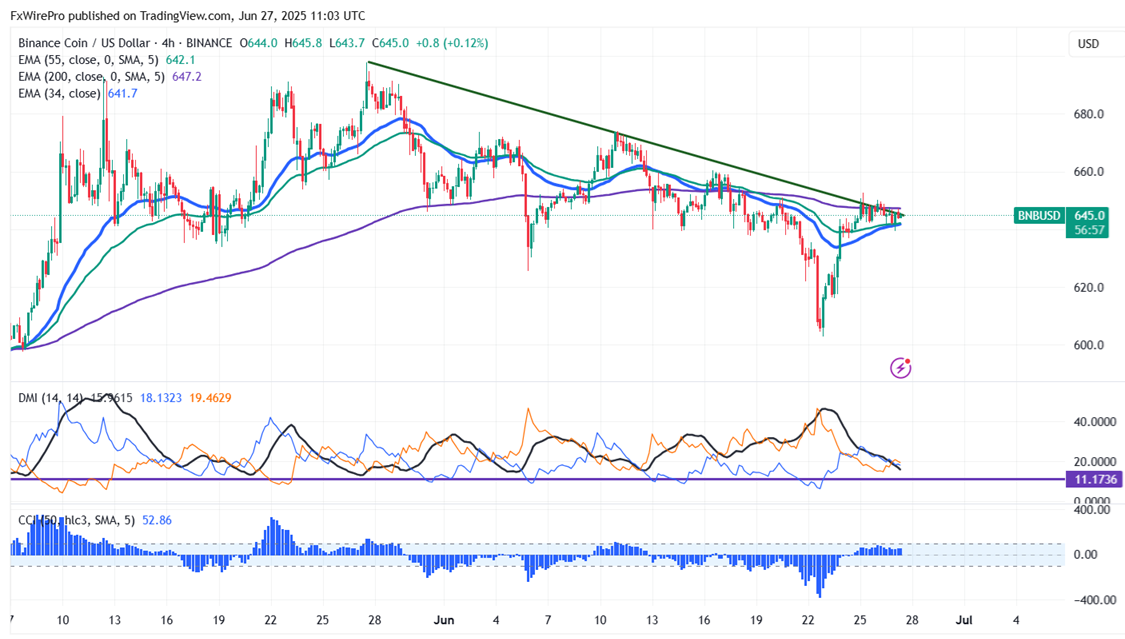
BNB/USD consolidates in a narrow range after a minor pullback. It hits an intraday high of $647 and is currently trading around $645.10.
Short term trend remains bullish as long as support $598 holds. It trades above the 55 and 34, 200 and 365 EMA on the 4- hour chart. Near-term support is around $628 (200- EMA) , any close below targets $598/$570/$520. If the pair closes below $500, potentially leading to further declines towards $400.
Immediate Resistance is at $660.Any breakout above this resistance confirms bullish momentum and a jump to could suggest bullish momentum, with further gains possible towards $669/$680/$730/$800/$1000. Near-term resistance is around $680.
Indicators (daily Chart)
- Directional Movement Index: Neutral
- CCI (50): Bullish
Trading Strategy
It is good to buy on dips around $625 with a stop-loss set at $595 and a target price of $800/$1000.


