


 FxWirePro: USD/CAD runs out of steam but maintains bullish outlook
  FxWirePro: USD/CNY edges lower , bearish outlook persists
  USD/CHF Surges on Broad Dollar Buying, Eyes 0.8200 Next
  FxWirePro: NZD/USD dips as geopolitical tensions weighs on Kiwi dollar
  FxWirePro : USD/JPY holds bullish bias despite intervention concerns
  FxWirePro- Major Pair levels and bias summary
  FxWirePro: AUD/USD slips on risk aversion as Middle East tensions escalate
  FxWirePro :USD/JPY hovers near 40-year high, bias bullish
  AUDJPY Range Traps Bulls: Sell Rallies at 112.60, Target 110
  FxWirePro- Major Crypto levels and bias summary
  PY Bulls Hold the Line: 92.60 Support Fuels Dip-Buy Setup to 95


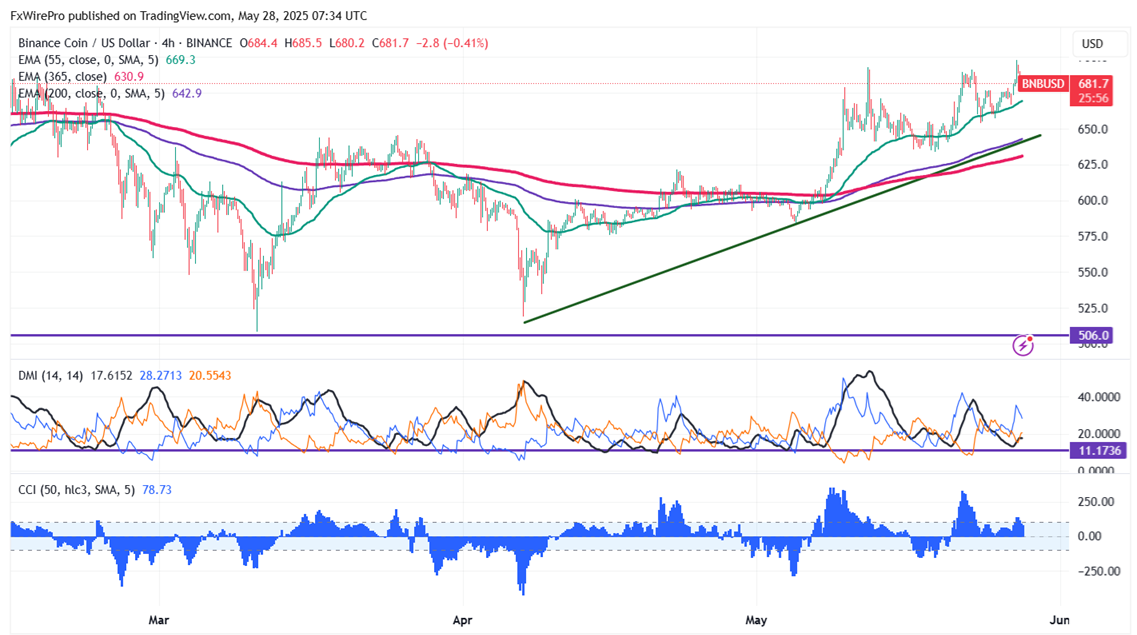
BNB/USD struggled to break above the significant resistance of $700 and showed a minor sell-off after hitting a high of $697.70. It hit an intraday low of $680 and is currently trading around $681.50.
Short-term trend remains bullish as long as support $650 holds. It trades above the 55 and 34,200 EMA on the 4-hour chart. Near-term support is around $650, any breach below targets $630/$600/$570/$520. If the pair closes below $500, potentially leading to further declines towards $400.
Immediate Resistance is at $700. A successful breakout above this resistance could suggest bullish momentum, with further gains possible towards $730/$800/$1000.
Indicators (4-Hour Chart)
- Directional Movement Index: Neutral
- CCI (50): Bullish
Trading Strategy
It is good to buy on dips around $665 with a stop-loss set at $630 and a target price of $800/$1000.


