


 FxWirePro: NZD/USD dips as geopolitical tensions weighs on Kiwi dollar
  EURJPY Bullish Bias Holds Strong: Buy the 184.80 Dip Toward 187
  FxWirePro: GBP/USD weighed down by renewed Middle East attacks
  FxWirePro: NZD/USD advances as hawkish outlook by a top policy maker boosts kiwi dollar
  PY Bulls Hold the Line: 92.60 Support Fuels Dip-Buy Setup to 95
  FxWirePro- Major Crypto levels and bias summary
  EUR/USD Slips Below 1.1380 as US-Iran Tensions Fuel Dollar Demand
  FxWirePro: GBP/AUD caught in narrow range, bias neutral
  FxWirePro- Major Crypto levels and bias summary
  BTCUSD Bullish Breakout: Clears 800-EMA After Consolidation, Buy Dips Toward $74,900
  USD/CHF Surges on Broad Dollar Buying, Eyes 0.8200 Next


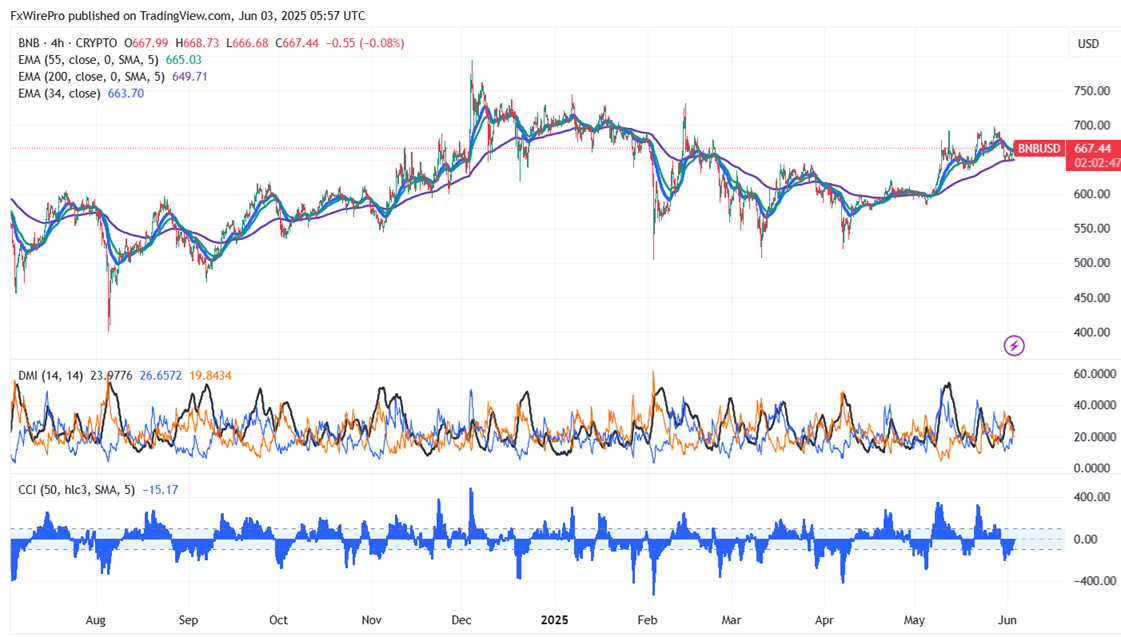
BNB/USD formed a triple bottom near $640 and showed a minor pullback. It hit an intraday high of $673.70 and is currently trading around $667.10.
Short-term trend remains bullish as long as support of $640 holds. It trades above the 55 and 34,200 EMA on the 4-hour chart. Near-term support is around $640(200- 4H EMA) , any breach below targets $630/$600/$570/$520. If the pair closes below $500, potentially leading to further declines towards $400.
Immediate Resistance is at $700. A successful breakout above this resistance could suggest bullish momentum, with further gains possible towards $730/$800/$1000.
Indicators (4-Hour Chart)
- Directional Movement Index: Neutral
- CCI (50): Bearish
Trading Strategy
It is good to buy on dips around $665 with a stop-loss set at $630 and a target price of $800/$1000.


