


 EURJPY Bullish Bias Holds Strong: Buy the 184.80 Dip Toward 187
  GBPJPY Bullish Bias Stays Strong: Buy the 217 Dip, Target 220
  FxWirePro: GBP/USD weighed down by renewed Middle East attacks
  FxWirePro- Major Crypto levels and bias summary
  BTCUSD Bullish Breakout: Clears 800-EMA After Consolidation, Buy Dips Toward $74,900
  NZDJPY Bulls Hold the Line: 92.60 Support Fuels Dip-Buy Setup to 95
  Bitcoin Pulls Back as US-Iran Tensions Stir Fresh Risk-Off Pressure
  FxWirePro- Major Pair levels and bias summary
  FxWirePro- Woodies pivot (Major)


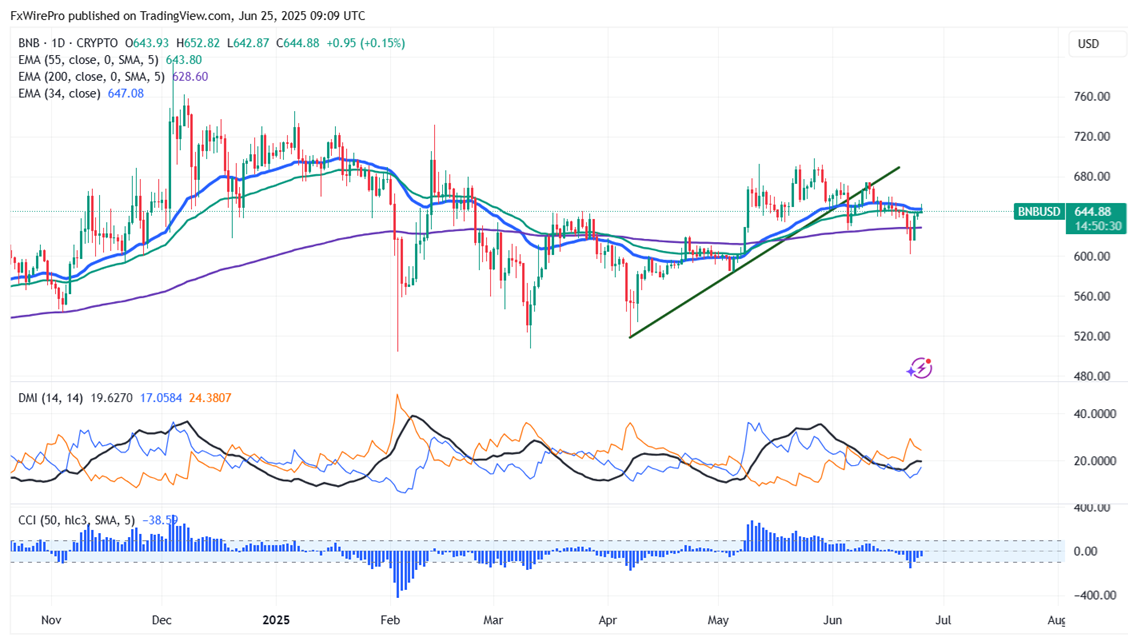
BNB/USD recovered sharply more than $40 following the footsteps of BTC. It hits an intraday high of $652 and is currently trading around $645.17.
Short term trend remains bullish as long as support $598 holds. It trades below the 55 and 34, above 200 and 365 EMA on the daily chart. Near-term support is around $628 (200- EMA) , any close below targets $598/$570/$520. If the pair closes below $500, potentially leading to further declines towards $400.
Immediate Resistance is at $660.Any breakout above this resistance confirms bullish momentum and a jump to could suggest bullish momentum, with further gains possible towards $669/$680/$730/$800/$1000. Near-term resistance is around $680.
Indicators (daily Chart)
- Directional Movement Index: Bearish
- CCI (50): Bearish
Trading Strategy
It is good to buy on dips around $625 with a stop-loss set at $595 and a target price of $800/$1000.


