


 FxWirePro- Major Crypto levels and bias summary
  FxWirePro:EUR/NZD stuck In narrow ranges, focus on near term support
  Gold Loses Steam After Strong U.S. Retail Sales
  FxWirePro: EUR/AUD outlook weaker on renewed downside pressure
  FxWirePro: USD/ZAR advances as South African rand weakens amid renewed Middle East tensions
  FxWirePro: GBP/USD under pressure despite UK's modest economic growth
  FxWirePro- Major Crypto levels and bias summary


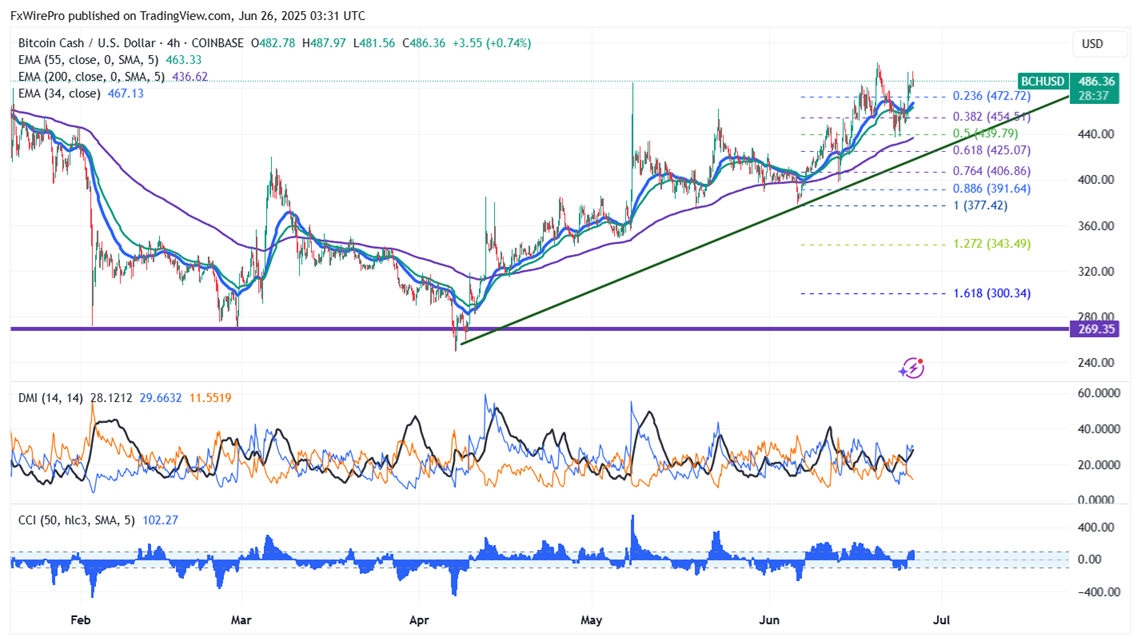
BCHUSD formed double bottom around $437 and showed a minor pullback. It hits a high of $494.84 and is currently trading around $486.91. Overall trend is bullish as long as support $435 holds.
The pair holds above the short-term (34 and 55-day EMA) and above the long-term moving average (200-day EMA).
The near-term resistance is around $503 any indicative breach above will take the pair to $525/$548/$600/$640. On the lower side, immediate support is $428, and any violation below targets $400/$377/$349/$325.
Indicators ( 4- hour chart)
Directional movement index - Bullish
It is good to buy on dips around $470-72 with SL around $435 for TP of $640.


