


 FxWirePro: USD/JPY uptrend loses steam, remains on bullish path
  FxWirePro- Major Pair levels and bias summary
  NZDJPY Bullish Surge: Strong Kiwi Ignites Fresh Upside as 94 Support Holds and All EMAs Align
  FxWirePro: NZD/USD trades in narrow range ,outlook bullish
  FxWirePro: GBP/USD hits one-month high, scope for further upside
  FxWirePro: USD/ZAR advances as South African rand weakens amid renewed Middle East tensions
  FxWirePro: EUR/AUD neutral in the near term, scope for downward resumption
  Major Pair Action Bias: Extremely Bullish Surge Powers GBPUSD & NZDUSD as Bullish Momentum Ignites
  FxWirePro:EUR/NZD dips below lower range, bearish bias increases
  FxWirePro: GBP/USD under pressure despite UK's modest economic growth
  JPY Action Bias: Extremely Bullish Surge Ignites Across NZD, GBP & AUD
  Gold Loses Steam After Strong U.S. Retail Sales
  EUR/USD Holds Bullish Tone Despite Pullback from Yesterday’s High
  FxWirePro- Major Crypto levels and bias summary
  FxWirePro- Major Crypto levels and bias summary


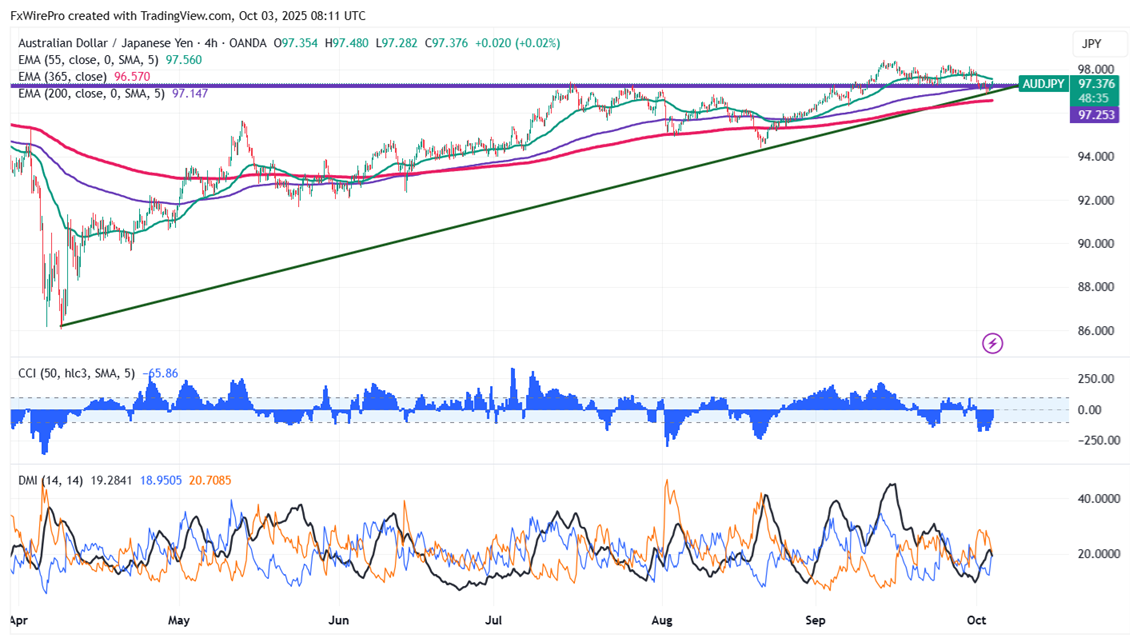
AUD/JPY took support near the trend line support and showed a minor pullback. Reaching an intraday high of 97.48, it now trades at around 97.37. The intraday trend is bearish as long as the resistance at 98.25 holds.
Oscillators and moving averages to forecast the trend of NDJPY
CMP- 97.38
EMA (1-hour chart)
55-EMA- 97.315
200-EMA- 97.55
365-EMA- 97.62. The pair trades above the short and below the long-term moving average.
This week's low- 96.85 (Oct 2nd low). Any breach below 96.85 will drag the pair down to 96.51/96/95.
This week's high- 98.15 (Sep 25th high). Any break above 98.25 confirms minor bullishness; a jump to 99/100 is possible. Minor resistance 97.61/97.80.
Indicator (4-hour chart)
CCI (50)- Bearish
Average directional movement Index- Neutral. All indicators confirm a mixed trend.
It is good to sell on rallies around 97.68-70 with SL around 98.25 for TP of 96.


