


 FxWirePro: USD/ZAR uptrend loses steam, remains on bullish path
  FxWirePro: AUD/USD edges higher but bearish outlook persists
  FxWirePro:NZD/USD edges lower, bearish outlook persists
  Ethereum’s $2,200 Ceiling: Can Diplomatic Breakthroughs Dissolve the Bearish Resistance?
  FxWirePro: USD/CAD positions for another climb, eyes 1.3900 level
  BTCUSD Coils in Tight Range: Will Geopolitical Stability Trigger a Breakout Toward $80,000?
  NZDJPY in Consolidation: Navigating the 92.00 Range as Bearish Clouds Gather
  FxWirePro: GBP/NZD runs out of steam but maintains bullish outlook
  FxWirePro: AUD/USD downside pressure builds, key support level in focus
  Bitcoin Reclaims USD 71,000 Milestone: Bullish Sentiment Resurges as Geopolitical Tensions Ease
  FxWirePro- Major Crypto levels and bias summary
  FxWirePro- Major Crypto levels and bias summary


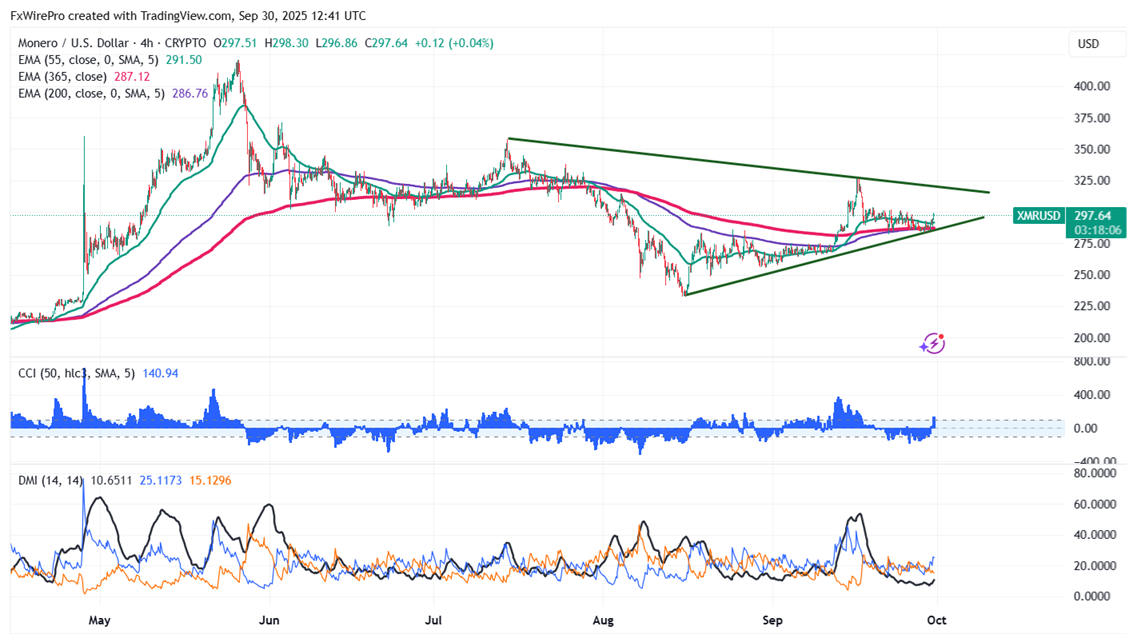
XMRUSD showed a pullback after a minor sell-off from the temporary top $326. It hits an intraday high of $299.53 and is currently trading around $297.86.
Oscillators and moving averages to forecast the trend of XMR
CMP- $297.72
EMA (4-hour chart)
55-EMA- $291.27
200-EMA- $286.65
365-EMA- $287.07. The pair trades above the short and long-term moving averages.
Previous week low- $282.40 (Sep 22nd low). Any breach below $280 will drag the pair down to $268.50/$253.
Previous week high- $302 (Sep 22nd high). Any break above $302 confirms minor bullishness, a jump to $310/321 (trend line joining $357.59 and 326.89)/$326.89 (Sep 16th high)/$357.59 (Jul 14th high).
Indicators (4-hour chart)
CCI(50)- Bullish
ADX- above 20 showing neutral bias
Investment Strategy for XMRUSD
It is good to buy on dips around $291-92 with a stop loss around $280 for target profits of $326/$357.


