


 FxWirePro- Major Pair levels and bias summary
  FxWirePro: USD/CAD positions for another climb, eyes 1.3900 level
  FxWirePro:NZD/USD treads water as Iran uncertainty keeps traders on edge
  FxWirePro:NZD/USD edges lower, bearish outlook persists
  FxWirePro: GBP/AUD edges lower, downside risk remains
  FxWirePro- Major Crypto levels and bias summary
  FxWirePro: USD/CAD remains buoyant, looks to extend gains
  FxWirePro: EUR/AUD consolidating around 1.6650, room for further gains
  FxWirePro: EUR/AUD neutral in the near-term, scope for downward resumption
  FxWirePro- Major Crypto levels and bias summary
  FxWirePro: USD/ZAR uptrend loses steam, remains on bullish path
  FxWirePro- Woodies Pivot(Major)
  FxWirePro- Major Pair levels and bias summary
  FxWirePro: USD/JPY uptrend loses steam, remains on bullish path
  FxWirePro: USD/JPY edges up, looks to extend gains
  Sterling’s Steady Ascent: GBPJPY Tests the 213.31 Resistance Amid a Two-Week Consolidation
  Ethereum’s $2,200 Ceiling: Can Diplomatic Breakthroughs Dissolve the Bearish Resistance?


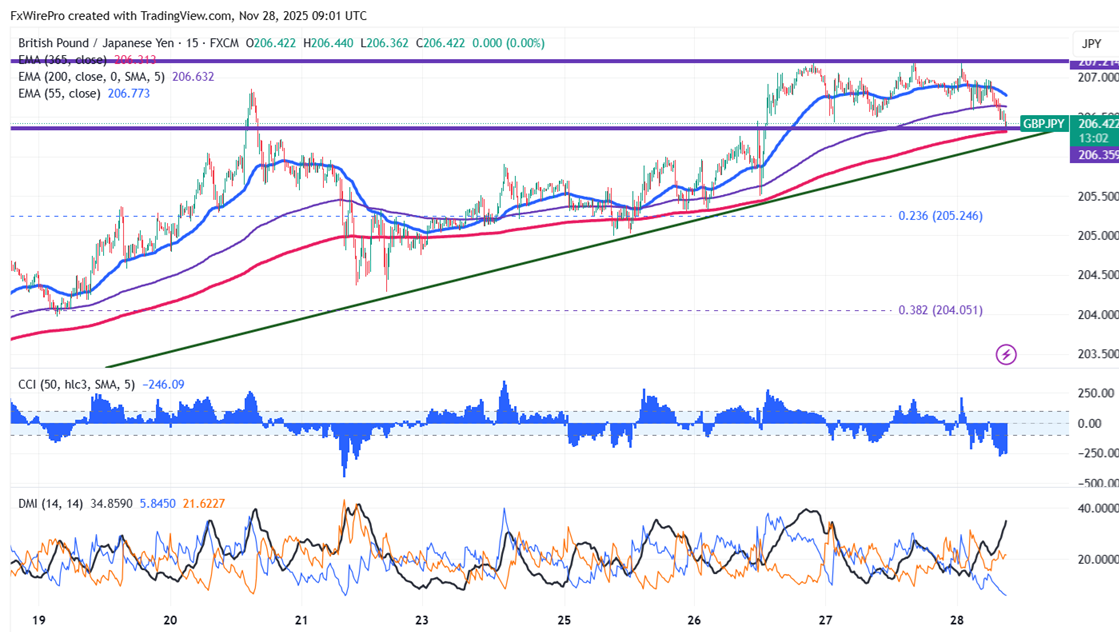
GBPJPY formed a double top around 270.20 and showed a minor sell-off. Intraday trend is neutral as long as the resistance at 207.25 holds. At the time of writing, it reached a low of 206.37 and is now trading about 206.614.
Oscillators and moving averages to forecast the trend of GBPJPY
CMP- 206.439
EMA (15-min chart)
55-EMA- 206.80
200-EMA- 206.63
365-EMA- 206.31. The pair trades below short (55- EMA) and above long term moving average(365 EMA and below 200 EMA).
Major Support- 206.40. Any breach below will drag the pair down 205.95/205.30/204.40/203.70/203.
Major resistance - 207.25. Any break above confirms minor bullishness, a jump to 208/209.20/210 is possible.
Indicator (15-min chart)
CCI (50)- bearish
Average directional movement Index- Bearish. All indicators confirm a bearish trend.
It is good to sell below 206.30 with SL around 206.85 for a TP of 204.30.


