


 BTC Flat at $89,300 Despite $1.02B ETF Exodus — Buy the Dip Toward $107K?
  Nasdaq Proposes Fast-Track Rule to Accelerate Index Inclusion for Major New Listings
  Elon Musk’s Empire: SpaceX, Tesla, and xAI Merger Talks Spark Investor Debate
  FxWirePro- Major Crypto levels and bias summary


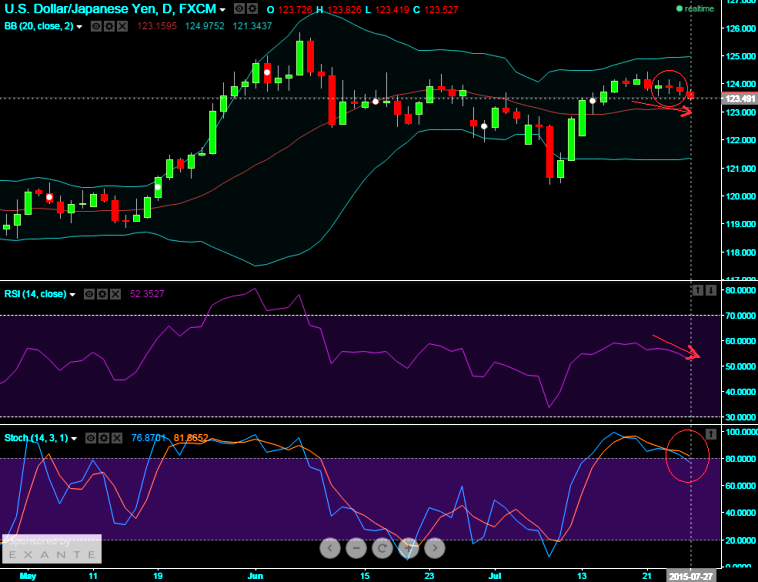
Technical glance:
EOD charts of USDJPY suggest weakness as the leading oscillating indicators such as RSI (14) and Slow stochastic evidence overbought pressure as strength index curve converges falling prices, while %D line crossover over above 80 levels on stochastic curves. And in addition back to back spinning top candles appeared to signify weakness on this pair.
If on a short straddle combination where a call and put options are written with delta's of 0.50 and -0.42 respectively how can this execution be delta hedged? The position is 1 of each written (underlying exchange price at 123.528 and ATM strike price at 123.530, 7 days maturity).
Delta hedging anything is pretty much the same process. Compute the delta of the position and then have a position in the underlying currency with -1*delta of the derivative position. Then have arrangements for adjusting the hedge so that it moves with the delta of the derivative position.
Write a straddle and you are short gamma and vega. You were delta hedging a position that is all about gamma and vega, all our bells and whistles would go off. There is a reason for doing this, but the person who has to ask how to do it doesn't know that reason.

- News

- Economy

- Central Banks
- Investing
- Research
- Roundups
- Digital Currency
- Insights
- Technical Analysis
- Technology
- Business
- Law
- Health
- Nature
- Fintech
- Science
- Topic
- Opinions
- ©Econometrics LLC . All Rights Reserved.
FxWirePro: Yen in mood of taming dollar’s upswings; Delta hedging of USD/JPY long straddles
Monday, July 27, 2015 6:17 AM UTC
Editor's Picks


- Market Data
Most Popular


