


Crude Oil is pulling away from the market's biggest storm in seven years. A measure of price volatility has tumbled from the highest level since January 2009 as the market frenzy eases amid a potential pact between the world's largest producers to freeze output.
Investors in February fixated on how and when Saudi Arabia would engage other producers clamouring for a way to boost prices.
From the " successful" talks between Saudi Arabian Oil Minister Ali al-Naimi and his Venezuelan counterpart early last month, to the Feb 16 Saudi-Russia output freeze announcement, to Iran's rejection of the plan as "ridiculous," the CBOE Crude Oil Volatility Index averaged the highest level since 2009.
Since the pact was announced, the measure of expectations of price swings has tumbled to the lowest in almost two months while oil has gained about 18 percent to trade near $35.
Since the Saudis and Russia reached an agreement to freeze output, volatility in the market has eased and oil prices have stabilized with the focus shifting back to fundamentals. More stable oil prices are expected in the coming months, possibly between 35-40 levels, at least until the next OPEC meeting in June.
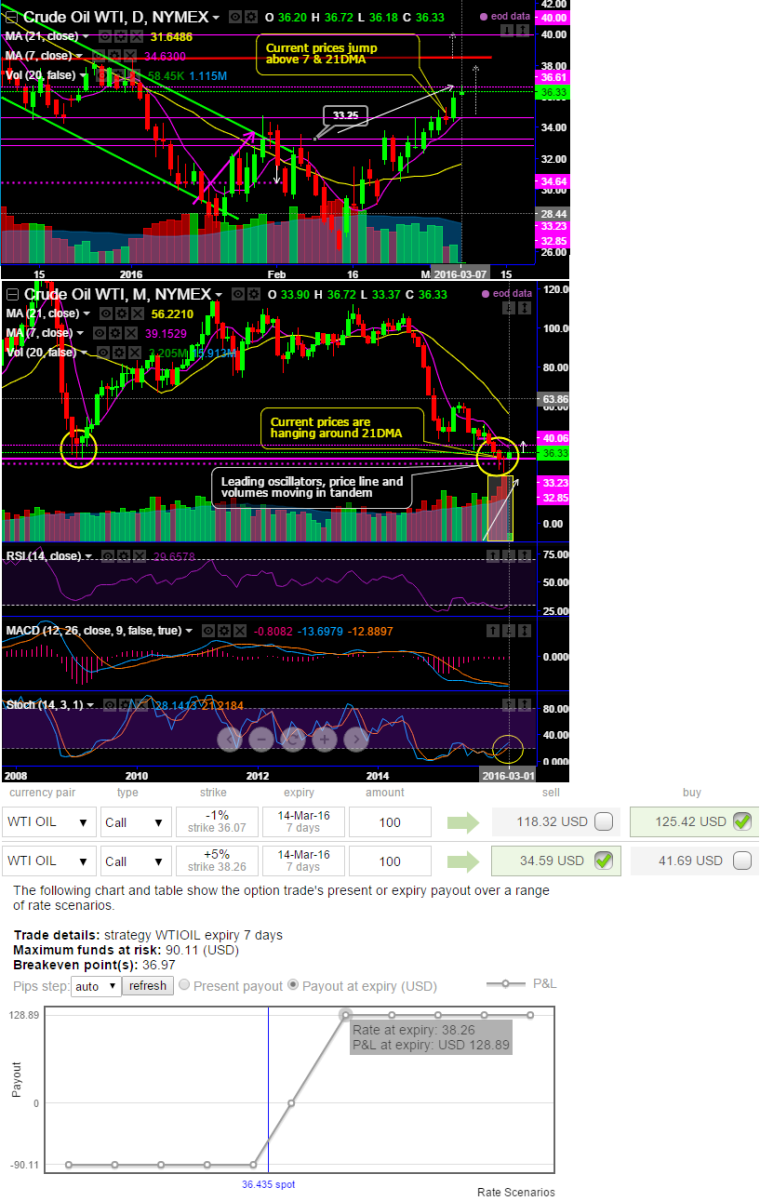
Technical glimpse and hedging frameworks:
Buying momentum has been intensifying as it has broken crucial resistance at 34.64 levels on an intraday terms but when we consider the short-to- intermediate term trend of this commodity it shows a short term targets upto 38.38 levels and even upto $40 a barrel upon breach of 1st target.
In addition to a bullish pattern candle such as dragonfly doji is traced out at 33.75 on monthly plotting, this has been able to prop up prices effectively after breaking 33.23 support decisively (see grey shaded areas for price conformity when prices pushing up vigorously).
As the bulls have shown clear buying interest at this juncture (lows of 2009) to substantiate the leading indicators on monthly and daily charts are converging beautifully to the current upswings that would suggest the strength in prices at this point, however, for reversal of previous downtrend is still deemed as hasty decision.
So, Let's suppose following spreads that is likely derive positive cash flows in short run, as shown in the diagram, we like to have 2W in the money WTI +0.51 delta call option (1% strike)and simultaneously, short an out of the money call (5% strike i.e. 1st target) of 1W tenor with positive theta values.
This would mean that the chances of upside risks of would be taken care by long positions (ITM calls).
The hedging cost would be reduced by short positions as shown in the diagram if the underlying commodity price rallies or rises upto 38.38 and prices stay stagnant within shorter tenor (should not go beyond these levels in 1W).
Vertical bull spread strategy is employed if you think that the price of the underlying WTI crude will rise reasonably in the near term but within a bracket of 5% upward range.

- News

- Economy

- Central Banks
- Investing
- Research
- Roundups
- Digital Currency
- Insights
- Technical Analysis
- Technology
- Business
- Law
- Health
- Nature
- Fintech
- Science
- Topic
- Opinions
- ©Econometrics LLC . All Rights Reserved.
FxWirePro: WTI crude's attempts of bottoming out at lows of 2009, don't jump into conclusion instead deploy vertical spreads to hedge upside risks
Monday, March 7, 2016 11:05 AM UTC
Editor's Picks


- Market Data
Most Popular


