


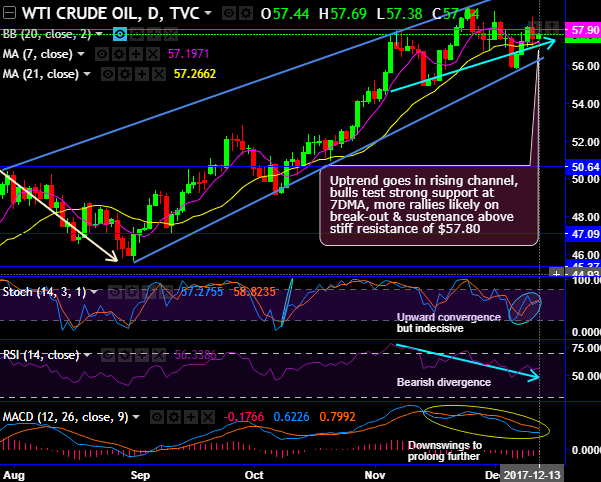
Chart pattern formed- Rising channel on daily terms and Symmetric triangle resistance break-out on monthly terms.
Major supports are observed at $57.18 and $55.77 levels, and bulls have managed to test these major supports before bouncing back.
While the stiff resistance is seen at $57.90 and $60.10 levels.
There has been a tight tug of war between bulls and bears, consequently, today’s trend has been drifting into the narrow range.
While both leading oscillators have been indecisive currently and shown downward convergence to the price dips.
While on a broader perspective, bulls in the consolidation phase have managed to break-out the symmetric triangle resistance, but one more stiff resistance at 60.10 is closely watched.
The sustenance above EMAs with bullish MACD and EMA will more likely to break out these levels.
Both leading as well as lagging indicators to converge these bullish sentiments.
Trade tips:
Intraday traders are likely to sense more volatilities in the US sessions ahead of EIA’s inventory check which is due to be announced.
It is wise to use dips to deploy long hedges using forward contracts, we advocate adding longs in mid-month futures with a view to arresting upside risks.


