


 BTC Flat at $89,300 Despite $1.02B ETF Exodus — Buy the Dip Toward $107K?
  US Gas Market Poised for Supercycle: Bernstein Analysts
  S&P 500 Relies on Tech for Growth in Q4 2024, Says Barclays
  Gold Prices Fall Amid Rate Jitters; Copper Steady as China Stimulus Eyed
  Trump’s "Shock and Awe" Agenda: Executive Orders from Day One
  China’s Growth Faces Structural Challenges Amid Doubts Over Data
  UBS Projects Mixed Market Outlook for 2025 Amid Trump Policy Uncertainty


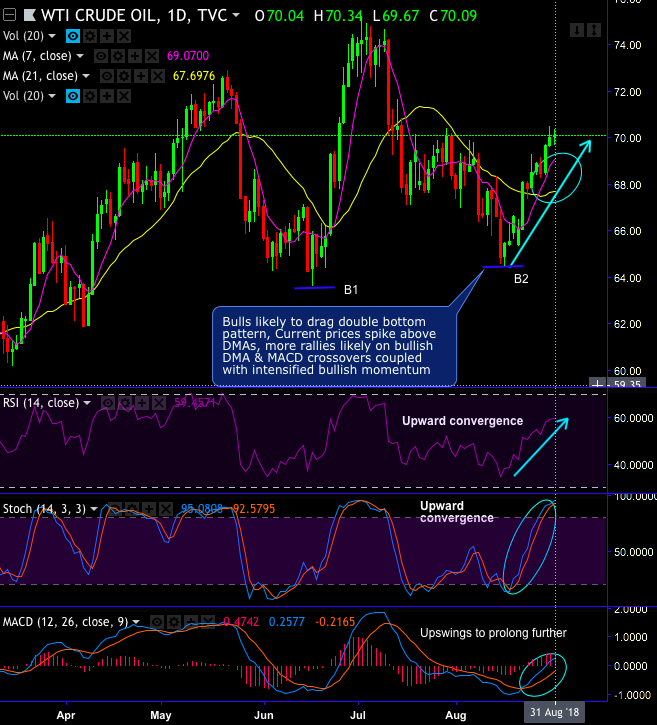
On daily chart of WTI crude, double bottom pattern has occurred with bottom 1 at 63.63 and bottom 2 at 64.45 levels.
Current prices spike above DMAs after stern bullish candle with big real body last week (refer daily chart). For now, upswings seem to be most likely upon bullish DMA and MACD crossovers coupled with intensified bullish momentum as both leading oscillators (RSI & stochastic curves) show upwards convergence to the price rallies.
While consolidation phase in the major trend breaks out symmetric triangle resistance (refer monthly chart). The current major trend appears to be little edgy at 50% Fibonacci levels on shooting star formation, where both leading oscillators on this timeframe signal overbought pressures.
Energy commodities analysts project more than one million barrels a day of Iran's roughly 2.5 million barrels a day of exports could be at risk. While Washington has contended that countries eliminate their purchases of Iranian oil -0.68%.
Trade recommendation:
On hedging grounds, we maintain short positions in ICE Brent calendar spread (short ICE Dec 18 vs ICE Dec 19), short NYMEX WTI Sep/Oct’18 time spread and short NYMEX WTI Oct’18 versus long Brent Oct’18 contract.
Currency Strength Index: FxWirePro's hourly EUR spot index has shown -70 (which is bearish), while USD is flashing at 60 (bullish), while articulating at 12:31 GMT.
For more details on the index, please refer below weblink:


