


 Indonesia Surprises Markets with Interest Rate Cut Amid Currency Pressure
  2025 Market Outlook: Key January Events to Watch
  Fed’s Goolsbee Warns Inflation Remains Elevated, Signals Caution on Rate Cuts
  China’s Growth Faces Structural Challenges Amid Doubts Over Data
  Lithium Market Poised for Recovery Amid Supply Cuts and Rising Demand
  Stock Futures Dip as Investors Await Key Payrolls Data
  Eurozone Recession Risks Rise as Middle East Conflict Threatens Growth, ECB Official Warns
  European Stocks Rally on Chinese Growth and Mining Merger Speculation
  UBS Predicts Potential Fed Rate Cut Amid Strong US Economic Data
  US Futures Rise as Investors Eye Earnings, Inflation Data, and Wildfire Impacts


Although the March meeting ended last week a roughly 1:4 shot for a hike, a range of FOMC members and the Chair herself pushed it to fully priced by this Thursday.
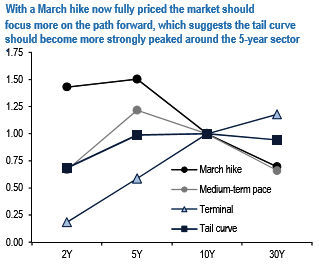
With March fully priced, markets should turn to focus on the path of hikes which argues for taking profits on longs in 3 versus 10-year tails and replacing them with longs in 5-versus 30-year tails.
FF/LIBOR spreads narrowed sharply in the spot and forward space, likely driven primarily by supply technicals and abundant cash in the front end.
Unsurprisingly, the upper left of the implied volatility surface was bid this week as the market rather dramatically re-priced near-term Fed expectations.
The tail curve was notably flatter since we last published, with 3-month volatility on 2-yar tails up 1.4 abp, while 5s were roughly unchanged and 10-and 30-year tails were down 2.1 and 3.5 abp, respectively.
The bottom right of the grid outperformed on light volatility supply, with most long-dated structures in 20-and 30-year tails unchanged to down small as of Friday’s close.
The above chart illustrates the volatility relative to 10-year tails assuming next hike odds, the near-term path of hikes, or terminal Fed funds are the primary drivers* of daily price action relative to the tail curve as of 3/3/17; unitless.
Based on the partial beta of daily changes with respective to 3/15/17x1M OIS rates, Z7/Z8x1M OIS curve slope, and 5Yx5Y OIS rates. Based on a 3-month regression of daily changes in each swap rate versus the same in these factors.


