


USD/JPY chart - Trading View
Spot Analysis:
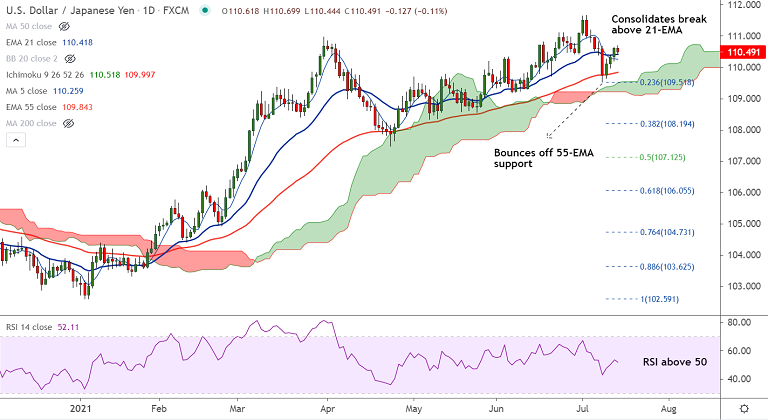
USD/JPY was trading 0.10% lower on the day 110.50 at around 05:40 GMT.
Previous Week's High/ Low: 111.19/ 109.53
Previous Session's High/ Low: 110.64/ 110.19
Fundamental Overview:
The greenback benefited from firm inflation data on Tuesday, but is currently struggling to extend gains.
U.S. headline inflation data rose past 4.9% expected to 5.4% YoY while the core reading was also upwardly revised from 3.8% to 4.5%.
Upside capped ahead of U.S. PPI data and the scheduled testimony from Federal Reserve Chairman Jerome Powell.
Technical Analysis:
- USD/JPY has paused 3 consecutive session's of gains
- The pair is consolidating break above 21-EMA
- Analysis of GMMA indicator shows major trend is bullish while minor trend is turning bullish
- Price action hovers around 200H MA, decisive break above to buoy bulls
Major Support and Resistance Levels:
Support - 110.41 (21-EMA), 110.25 (5-DMA), 109.84 (55-EMA)
Resistance - 110.54 (200H MA), 110.60 (20-DMA), 111 (Psychological mark)
Summary: USD/JPY consolidates break above 21-EMA. Technical analysis suggests scope for upside resumption. Focus on U.S. PPI data and Powell's testimony for impetus.


