


USD/JPY chart - Trading View
USD/JPY was trading 0.23% higher on the day at 111.87 at around 09:55 GMT.
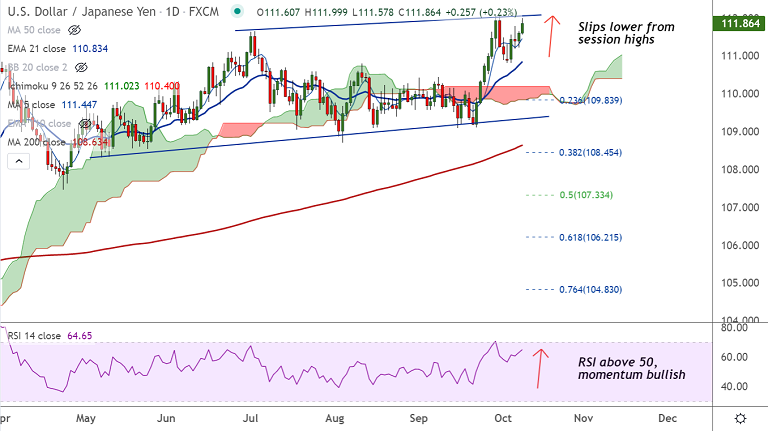
The pair edges lower from session highs at 111.99, pauses shy of 112 handle.
Price action is grinding higher in rising channel pattern, momentum is bullish.
The price is testing channel top resistance, decisive break above will fuel further upside.
The pair is trading above daily cloud and chikou span is biased higher.
Major moving averages are trending higher. GMMA indicator shows major and minor bias is strongly bullish.
Focus on US non-farm-payrolls data for impetus. Analysts expect an increase of 488,000 jobs in September.
Major Support Levels:
S1: 111.42 (5-DMA)
S2: 110.82 (21-EMA)
S3: 110.59 (20-DMA)
Major Resistance Levels:
R1: 112 (Channel top)
R2: 112.22 (Feb 2020 high)
R3: 112.76 (Upper monthly BB)
Summary: USD/JPY was trading with a bullish bias. Watchout for channel breakout for upside continuation.


