


USD/JPY chart - Trading View
- USD/JPY extended weakness on Thursday's trade despite upbeat US durable goods orders data.
- The greenback failed to capitalize on its early move higher, slipped lower as cautious mood around equity markets underpinned the Japanese Yen's relative safe-haven status.
- Data released earlier today showed Japanese industrial production data came in below-forecast.
- Japan's factory output in March fell 0.9 percent month-on-month, the biggest drop since 2015, missing forecasts for drop by 0.1 percent.
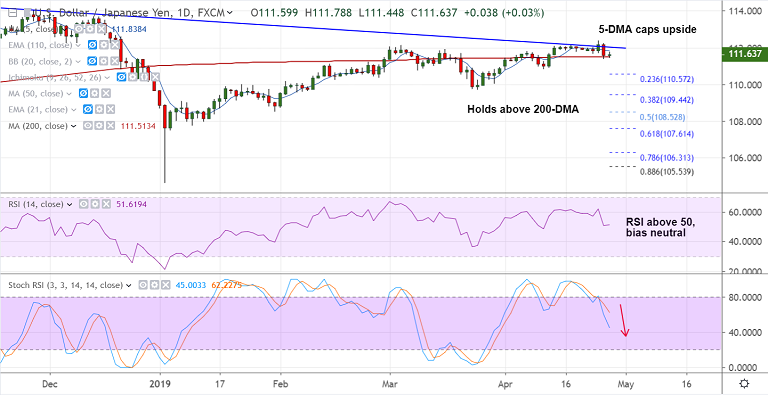
- The major is trading rangebound above 200-DMA, Doji formation seen on the daily candle.
- Technical bias remains to the downside. RSI has turned and break below 200-DMA will see dip till 23.6% Fib at 110.57.
- A decisive break above 112 handle required for any upside. Next major resistance above 112 lies at 78.6% Fib at 112.43.
Support levels - 111.51 (200-DMA), 110.57 (23.6% Fib), 110.01 (Mar 28 low)
Resistance levels - 111.83 (5-DMA), 112, 112.43 (78.6% Fib), 112.88 (Oct 22 high)
Recommendation: Watch out for break below 200-DMA to go short.
For details on FxWirePro's Currency Strength Index, visit http://www.fxwirepro.com/currencyindex.


