


Chart - Courtesy Trading View
Technical Analysis:
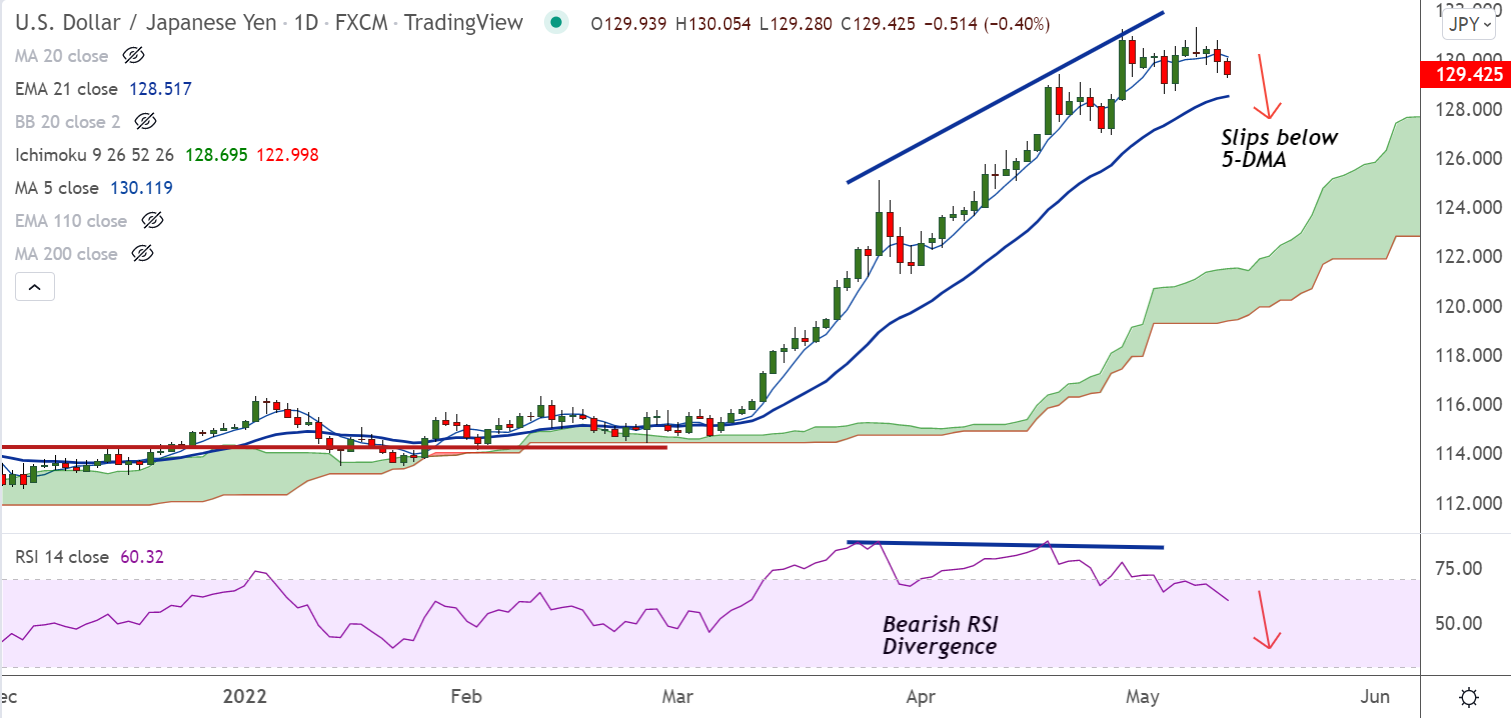
- USD/JPY was trading 0.36% lower on the day at 129.45 at around 06:45 GMT
- The pair is extending weakness for the 2nd straight session, slips below 5-DMA
- Bearish RSI divergence adds to the bearish bias, RSI shows rollover from overbought levels
- Price action has slipped below 200H MA, GMMA indicator shows bearish shift on the intraday charts
Fundamental Overview:
US dollar struggles to cheer firmer inflation numbers as stubborn U.S. inflation stokes worries on rates, growth
US annual Consumer Price Index printed at 8.3%, higher than the 8.1% anticipated.
The monthly figure was up 0.3% against the 0.2% expected. On an annual basis core CPI hit 6.2%, slightly below the previous 6.5%, but above the 6% expected.
Focus now on monthly prints of the US Producer Price Index (PPI) for April, expected 10.7% YoY versus 11.2% prior.
An upbeat factory-gate inflation will portray the increasing price pressures adding to the hawkish Fed chatters, thereby buoying USD to renew multi-year highs.
Major Support and Resistance Levels:
Major Support: 128.50 (21-EMA), Major Resistance: 130.16 (200H MA)
Summary: USD/JPY bias has shifted bearish on the intraday charts. Next major support lies at 21-EMA at 128.50. Break below will drag the pair lower.


