


USD/JPY chart - Trading View
USD/JPY Spot: 108.80 at 06:00 GMT
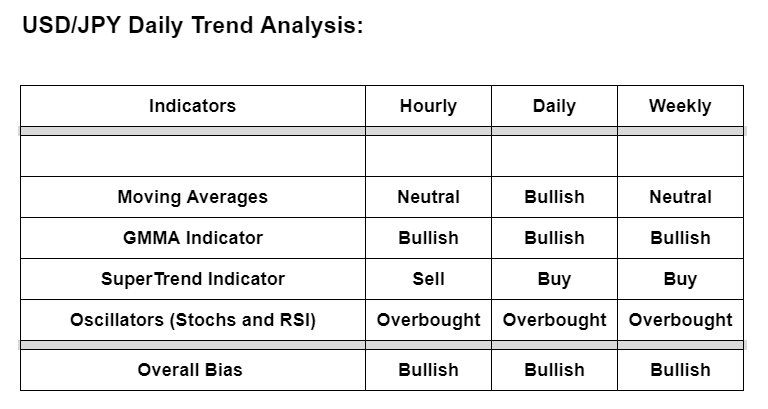
Technical Bias: Bullish
Technical Analysis:
Moving Averages: Price action is above major moving averages and moving averages are biased higher on the daily charts
GMMA Indicator: Analysis of GMMA indicator shows major and minor trend are bullish on daily, weekly and hourly charts
SuperTrend Indicator: SuperTrend indicator gives a Buy signal on daily and weekly charts. Weakness on the hourly charts could provide a good opportunity for entry
Oscillators (Stochs and RSI): Overbought conditions on weekly and intraday charts warrants caution for possibility of pullbacks
Support levels - 108.60 (5-DMA), 108.23 (61.8% Fib), 108.02 (200H MA)
Resistance levels - 109 (200W MA), 109.56 (76.4% Fib), 109.85 (June 2020 high)
Summary: US dollar is catching a fresh bid tone amid souring risk sentiment. Mixed vaccine updates and geopolitical tension concerning China likely to keep gains in check. Focus on US Michigan Consumer Sentiment figures for March for fresh impulse. UMich Consumer Sentiment Index is expected to rise to 78.5 in March from 76.8 in February. Technical bias is bullish. 200W MA is major resistance. Decisive break above to propel prices higher.


