


USD/JPY chart - Trading View
- USD/JPY extends gradual grind higher, trades at 110.21 at 04:00 GMT.
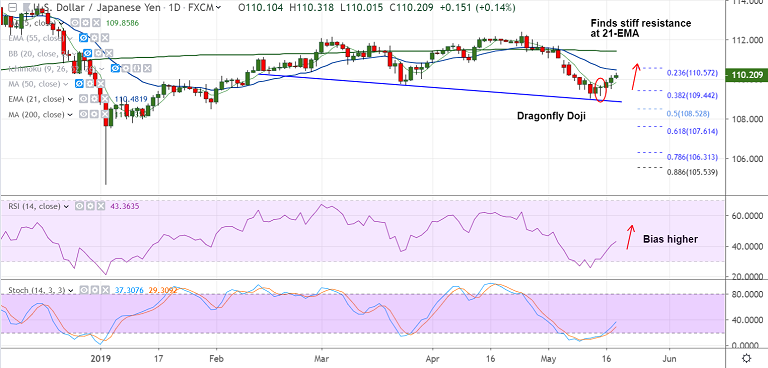
- Price is edging higher for the 5th straight session, on improved risk sentiment.
- Short-term outlook would turn bullish if the pair breaks above 21-EMA (currently at 110.48).
- Price action is above 200-SMA and hourly cloud. The pair has also formed a 'Golden Cross' on the hourly charts which adds to the bullish bias.
- Price may continue to track the action in the equities, focus also on Industrial Output and Capacity Utilization data.
- Break above 21-EMA will see gains upto 110-EMA at 110.97 ahead of 200-DMA a t 111.43.
- 5-DMA is immediate support at 109.86. Break below will see weakness till trendline support at 108.85.
Support levels - 109.86 (5-DMA), 109.44 (38.2% Fib), 109
Resistance levels - 110.48 (21-EMA), 110.97 (110-EMA), 111.43 (200-DMA)
For details on FxWirePro's Currency Strength Index, visit http://www.fxwirepro.com/currencyindex.


