


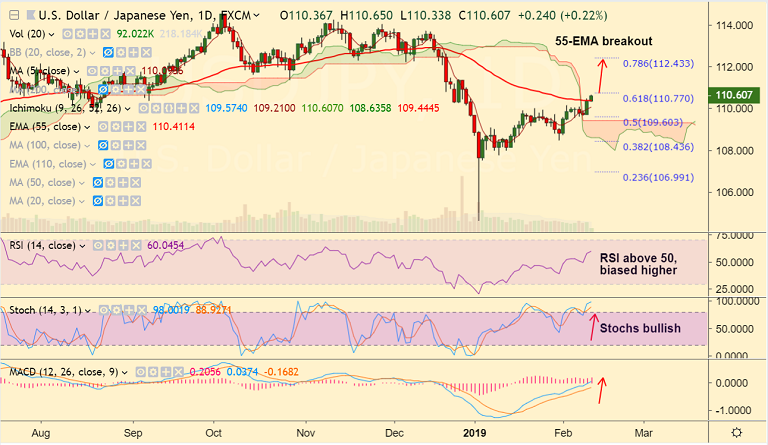
USD/JPY chart on Trading View used for analysis
- USD/JPY is currently trading 0.22% higher on the day at 110.60 at 0415 GMT.
- The pair largely ignores Bank of Japan's decision to cut bond purchases. The news fails to halt USD/JPY rally.
- BOJ trimmed purchases of long duration bonds for the first time since June 2018.
- The pair is extending gains for the 2nd straight session and has broken above 55-EMA.
- Technical studies support upside. RSI is above 50 and biased higher. Stochs are bullish and MACD supports upside.
- Immediate resistance is seen at 110-EMA at 110.94. Break above targets 200-DMA at 111.26.
- On the flipside, 21-EMA is strong support. Break below will negate any bullish bias.
Support levels - 110.41 (55-EMA), 110.09 (5-DMA), 109.77 (21-EMA)
Resistance levels - 110.77 (61.8% Fib), 110.94 (110-EMA), 111.26 (200-DMA)
Recommendation: Good to go long on dips around 110.50, SL: 110, TP: 110.80/ 111/ 111.25
For details on FxWirePro's Currency Strength Index, visit http://www.fxwirepro.com/currencyindex.


