


USD/JPY chart - Trading View
USD/JPY was trading 0.27% higher on the day at 107.59 at around 10:30 GMT.
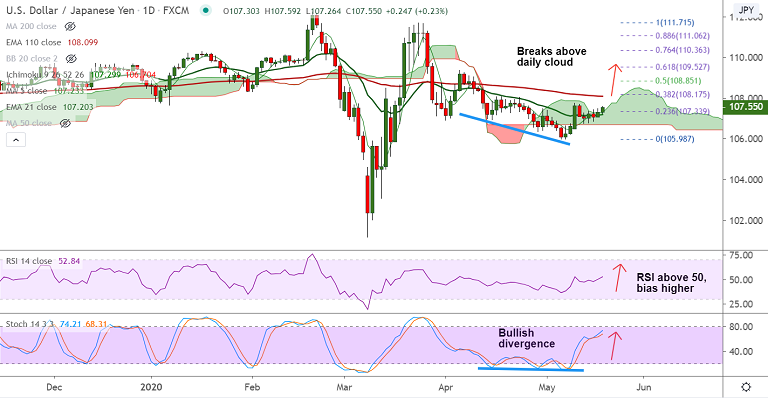
The pair has broken consolidation along 21-EMA support and is set to extend gains.
Price action has broken above daily cloud and momentum studies have turned bullish.
Stochs and RSI have turned bullish and 'Bullish divergence' on Stochastics on the daily charts adds to the bullish bias.
The pair has broken above 23.6% Fib retracement and we see little resistance till 110-EMA at 108.10.
Major trend as evidenced by the GMMA indicator is still bearish. However, breakout at 200-DMA could see shift in major trend.
FOMC minutes due Wednesday will be in focus for further impetus. On the data front later in the day, U.S. housing starts could impact price movement.
Support levels - 107.20 (21-EMA), 106.70 (Cloud base), 106.13 (Lower BB)
Resistance levels - 107.68 (55-EMA), 108.10 (110-EMA), 108.25 (200-DMA)


