


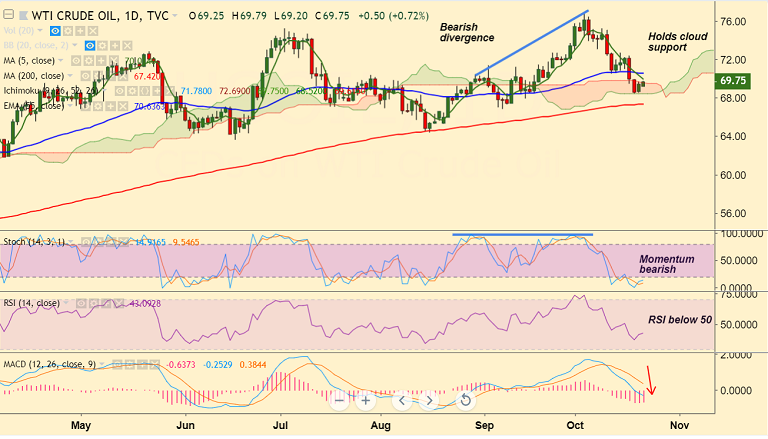
US oil chart on Trading View used for analysis
- US oil holds cloud support, edges higher for the 2nd straight session.
- Price has edged above 110-EMA at 69.30 and is currently trading at 69.76, up 0.35% on the day.
- Momentum studies are still bearish. RSI is well below 50 mark. MACD supports weakness.
- Baker Hughes data on Friday showed that the US drillers added four oil rigs in the week to Oct. 19.
- The total count now stands at 873, the highest level since March 2015. Signs of rising output is likely to cap upside.
- Immediate resistance is seen at 5-DMA at 70.02 ahead of 55-EMA at 70.63.
- On the flip side, we see strong support at cloud base at 69.61. Break below targets 200-DMA at 67.42.
Support levels - 69.61 (cloud base), 67.42 (200-DMA)
Resistance levels - 70.02 (5-DMA), 70.63 (55-EMA)
For details on FxWirePro's Currency Strength Index, visit http://www.fxwirepro.com/currencyindex.


