


Everything going in the Yen's favor as predicted in our previous write up. We have been already reiterating bearish trend and advised suitable hedging call in our previous articles as well on 2nd October, 7th and again on 22nd.
Please refer our previous post: http://www.econotimes.com/FxWirePro-Shooting-star-signals-GBP-JPYs-weakness-declines-to-resume-%E2%80%93-active-long-puts-in-PRBS-to-arrest-downswings-106117
With the below technical reasoning, we think arresting potential downside risks of this pair by hedging through Put Ratio back Spread. For now it is reckoned that the underlying currency GBPJPY to make a large move on the downside.
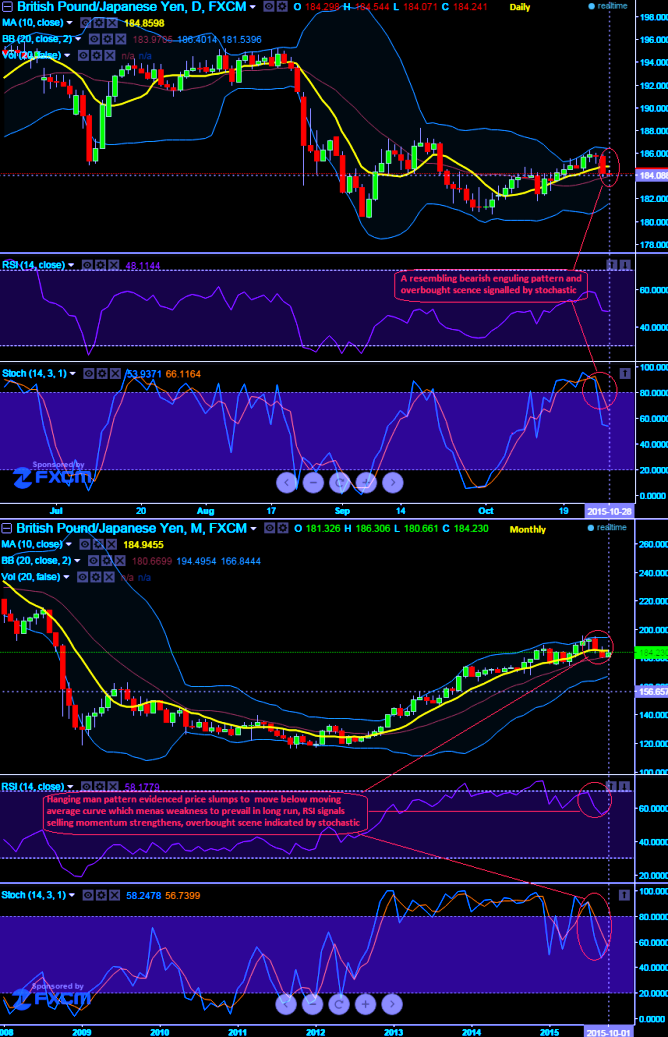
Now, it was urged for some corrections on GBPJPY upon the formation of "Gravestone Doji" pattern candle on peaks of uptrend at around 183.926 levels on daily chart followed by a shooting star at 184.079. Hanging man with downward convergence of leading oscillators is again bearish note on monthly chart. It is also important to emphasize that a hanging man candle pattern on monthly chart is a warning of potential price change, not a signal, in and of itself, to go short.
We now again traced bearish engulfing like pattern occurred at 184.298 that plunges the prevailing price below 10DMA.
We now reckon that these bearish patterns have more downside potential and would reveal a medium term downtrend direction.
By now shorts side of 1 lots of ITM put option would have generated assured returns on the recent rallies. We stated to maintain the same strategy for hedgers by using these small bounces from then to help our ITM shorts, this would have certainly ensured returns in the form of premiums.
Having said that, stay firm with longs on 2 lots of At-The-Money -0.50 delta puts as it has begun functioning effectively from recent past. Shortly longs on ATM puts are about to take care of potential downswings.
Hereafter, you can have a view on daily charts (the bearish signal spotted as you can see that from circled area, long put instruments to generate positive cash flows here onwards).

- News

- Economy

- Central Banks
- Investing
- Research
- Roundups
- Digital Currency
- Insights
- Technical Analysis
- Technology
- Business
- Law
- Health
- Nature
- Fintech
- Science
- Topic
- Opinions
- ©Econometrics LLC . All Rights Reserved.
FxWirePro: Stay strongly positioned in GBP/JPY PRBS – hard currency seems to dip further
Wednesday, October 28, 2015 6:04 AM UTC
Editor's Picks


- Market Data
Most Popular


