


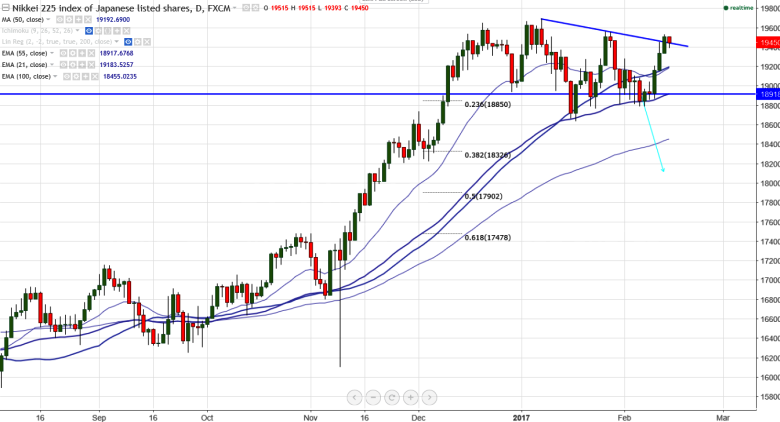
Nikkei broken the trend line resistance 19453 (trend line joining 19698 and 19566) and jumped till 19535 on account of weaker yen. Nikkei should break above 19566 high made on Jan 26th 2017 for further bullish continuation. It is currently trading at 19428 0.45% lower.
•The index is trading slightly stronger on account of weaker yen and the pair has jumped slightly above the major resistance of 113.95 (Feb 1st 2017 high). It's major resistance is around 115 and minor bullishness can be seen above that level.
• On the lower side , 19218 (7- day EMA) is acting as next immediate support and any break below targets 19150 (21-day EMA)/18990 (61.8% retracement of 18638 and 19566)/18850.
•The major weekly resistance is around 19566 (26th Jan 2017 high) and any break above will take the index till 19698/2000
It is good to buy on dips around 19350 with SL around 19200 for the TP of 19566/19698.


