


NZD/USD chart - Trading View
Spot Analysis:
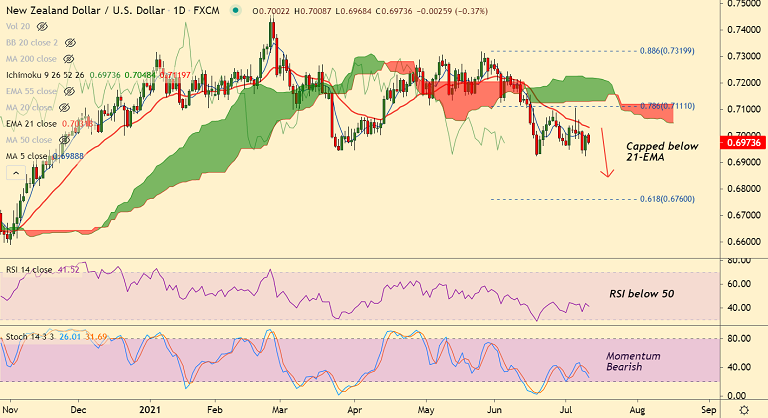
NZD/USD was trading 0.38% lower on the day at 0.6973 at around 07:10 GMT
Previous Week's High/ Low: 0.7105/ 0.6922
Previous Session's High/ Low: 0.7004/ 0.6922
Fundamental Overview:
With the spread of the new Delta variant, markets seem to be reassessing the pace of global economic recovery.
On the data front, focus will be on the US Core Consumer Price Index MoM and Retail Sales MoM.
Also, the Reserve Bank of New Zealand (RBNZ) policy decision could provide some clear direction.
Analysts expect the RBNZ to hold the official cash rate (OCR) at a record low of 0.25%.
The central bank is likely to drop a reference to "considerable time and patience" from its statement which could boost kiwi bulls.
Technical Analysis: Near-term bias bearish
- NZD/USD is consolidating dip below 200-DMA
- Major moving averages are biased lower
- GMMA indicator shows major and minor trend are bearish
- Momentum studies support downside, RSI below 50
- Recovery attempts are capped at 200H MA
Major Support and Resistance Levels:
Support - 0.6951 (55-week EMA), 0.6926 (Lower BB), 0.6831 (110-week EMA)
Resistance - 0.6998 (200H MA), 0.7012 (20-DMA), 0.7063 (200-DMA)
Summary: Technical bias for the pair shows weakness in the near-term. 55-week EMA is strong support and we see weakness only on decisive break below. On the flipside, retrace above 200-DMA will negate any bearish bias for the pair. RBNZ policy meet in focus for clear direction.


