


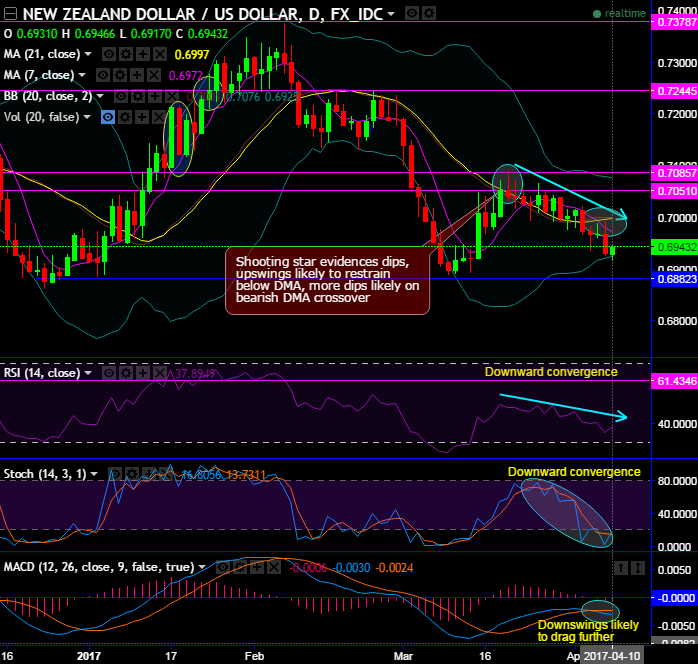
Please note that “shooting star and gravestone doji” patterns occurred at major resistance levels of 0.7085 and 0.6969 levels, as a result, bears have managed to plummet prices.
Currently, the upswings are likely to restrain below DMA, more dips likely on bearish DMA crossover.
The recent upswings have consistently rejected below a stiff resistance of 0.6969 levels.
On a broader perspective, shooting star pattern at around stiff resistance of 0.7410 evidences downswings below EMAs, bulls bounce back with engulfing pattern (see February month’s candle) to resume consolidation phase but again restrained below 0.7410, momentum bearish bias (refer monthly charts).
Consequently, bearish candles with big real bodies and upper & lower shadows occurred consecutively that they likely to finish with 3-black crows pattern.
To substantiate this bearish stance, both leading indicators (RSI & stochastic curves) evidence the bearish convergence that signals strength and momentum in selling interests.
Most notably, MACD remaining bearish trajectory on daily and monthly terms is an indication of extending bearish trend in the months to come, moreover, the rising volumes with falling prices would be in conformity to the major downtrend.
Trade tips:
Well, as a result of above technical reasoning, on speculative grounds we advise tunnel spreads which are binary versions of the debit put spreads.
This strategy is likely to fetch leveraged yields than spot FX and certain yields keeping upper strikes at 0.6959 and lower strikes at 0.6926 levels.


