


NZD/USD chart - Trading View
- NZD/USD has retraced from 7-week highs at 0.6938 hit earlier on the day and is trading at 0.6920 at 0555 GMT.
- Kiwi buoyed by upbeat GDP data. New Zealand's GDP data released in early Asia showed NZ economy expanded 0.6% q/q in the three months to Dec.
- Data was inline with analysts' expectations, and double the 0.3% pace of the third quarter, according to Statistics New Zealand.
- Further supporting upside was a dovish Fed overnight. The US 10 year yield dropped sharply and are set to extend weakness.
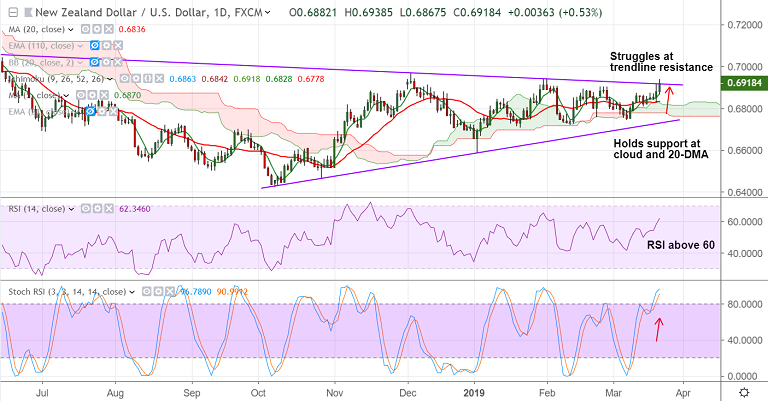
- Technical studies for the pair have turned bullish. RSI above 60 with further room to run.
- Price action has bounced off support at daily cloud and 20-DMA. Upside finds strong resistance at 0.6915 (trendline).
- Breakout at 0.6915 will see gains till 61.8% Fib at 0.7050. On the flipside break below 20-DMA will see dip till 200-DMA.
Support levels - 0.6870 (5-DMA), 0.6836 (20-DMA), 0.6816 (55-EMA)
Resistance levels - 0.6915 (trendline), 0.6969 (Dec 4 high), 0.70, 0.7050 (61.8% Fib)
Call update: Our previous call (https://www.econotimes.com/FxWirePro-NZD-USD-consolidates-above-daily-cloud-stay-long-above-06870-1512789) has hit .
Recommendation: Book partial profits at highs, watch out for decisive break above 0.6915 for further upside.
For details on FxWirePro's Currency Strength Index, visit http://www.fxwirepro.com/currencyindex.


