


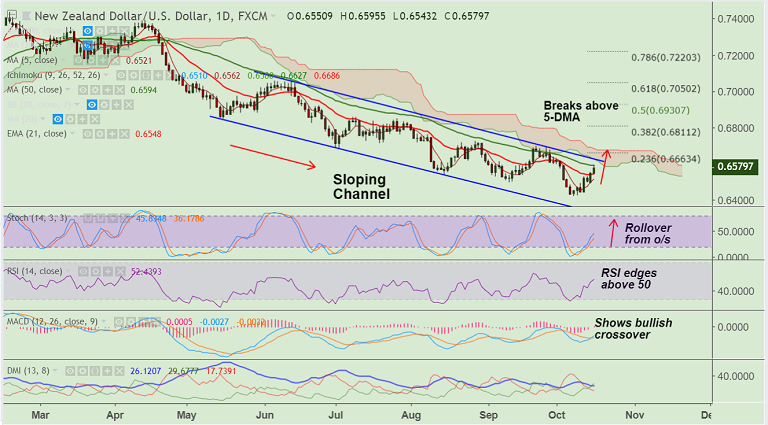
NZD/USD chart on Trading View used for analysis
- Kiwi remains buoyed after New Zealand CPI beats estimates, NZD/USD trades 0.44% higher on the day.
- New Zealand's Q3 CPI came in at 0.9% q/q, higher than forecasts at 0.7% and compared to 0.4% last. The annualized CPI was at 1.9% (forecast 1.7%, last 1.5%).
- The pair has edged above 4H 200-SMA and we see scope for further upside on the intraday charts.
- Major trend in the pair is bearish, but we see minor upside till 55-EMA at 0.6619. Violation there could see further upside.
- On the flipside, we see immediate support at 21-EMA at 0.6548. Break below to see resumption of weakness.
Support levels - 0.6566 (20-DMA), 0.6548 (21-EMA), 0.6521 (5-DMA)
Resistance levels - 0.6619 (55-EMA), 0.6625 (channel top), 0.67, 0.6731 (110-EMA)
Recommendation: Good to go long on dips around 0.6560/70, SL: 0.6520, TP: 0.66/ 0.6625
For details on FxWirePro's Currency Strength Index, visit http://www.fxwirepro.com/currencyindex.


