


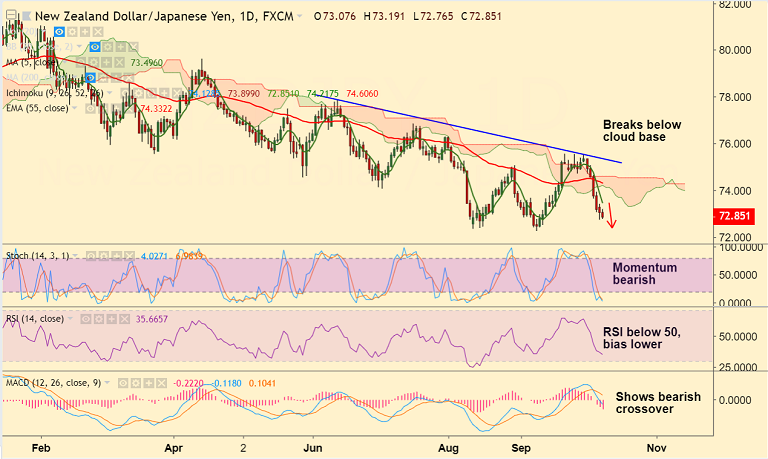
NZD/JPY chart on Trading View used for analysis
- NZD/JPY has resumed weakness below 73 handle, is trading 0.30% lower on the day at 72.86 at the time of writing.
- The pair has broken below daily cloud in the previous weeks trade and we see scope for further weakness.
- Technical indicators are bearishly aligned with downward sloping RSI and Stochs and bearish MACD crossover on signal line.
- Next bear target lies at 72.25 (2018 lows). Break below to see dip till 69.23 (2016 low).
- We see bearish invalidation only above 110-EMA at 75.06.
Support levels - 72.25 (Sept 10 low), 72, 69.23 (2016 low)
Resistance levels - 73.50 (5-DMA), 74.06 (21-EMA), 75.06 (110-EMA)
Call update: Our previous call (https://www.econotimes.com/FxWirePro-NZD-JPY-holds-support-at-cloud-base-good-to-go-short-on-break-below-1438668) is approaching final targets.
Recommendation: Stay short for targets.
FxWirePro Currency Strength Index: FxWirePro's Hourly NZD Spot Index was at -85.5739 (Bearish), while Hourly JPY Spot Index was at 60.9173 (Neutral) at 1105 GMT.
For more details on FxWirePro's Currency Strength Index, visit http://www.fxwirepro.com/currencyindex.


