


NZD/JPY chart - Trading View
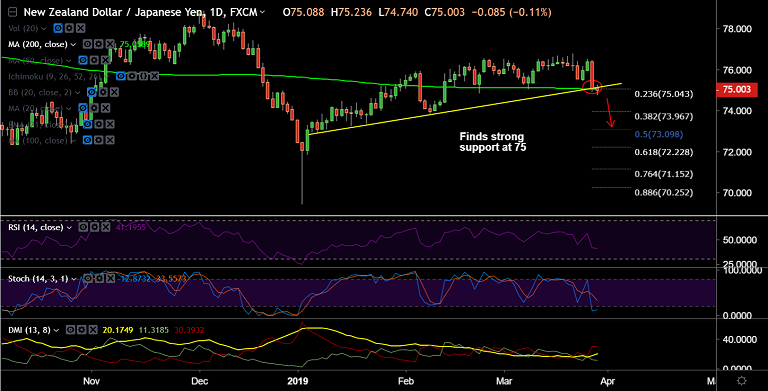
- NZD/JPY is hovering around 200-DMA, break below will see further weakness.
- The pair has edged higher from session lows at 74.74, is currently trading at 75.0, 0.13% lower on the day.
- Technical indicators are biased lower. RSI is below 50 and biased lower, Stochs show momentum is with the bears.
- Cloud is offering support at 74.91. Break below will see drag lower.
- Dip till 38.2% Fib at 73.96 likely. Further weakness will see next major support at 73.09 (50% Fib).
- On the flipside, retrace and close above 200-DMA could negate the bearish bias.
Support levels - 74.91 (cloud top), 73.96 (38.2% Fib), 73.09 (50% Fib), 72.22 (61.8% Fib)
Resistance levels - 75.05 (200-DMA), 75.42 (110-EMA), 75.56 (55-EMA)
Recommendation: Stay short on decisive break below 200-DMA, SL: 75.50, TP: 74/ 73/ 72.25
For details on FxWirePro's Currency Strength Index, visit http://www.fxwirepro.com/currencyindex.


