


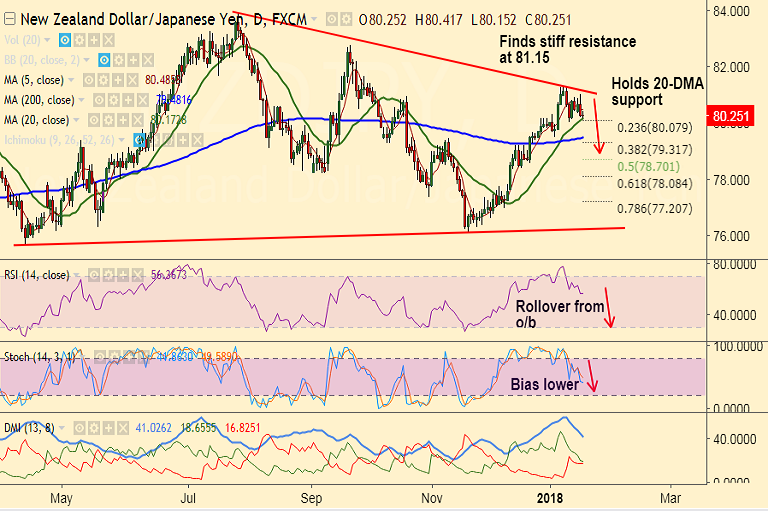
- NZD/JPY failed to break stiff trendline resistance currently at 81.15, slips lower.
- The pair closed below 5-DMA at 80.47 on Tuesday's trade and is currently hovering around 20-DMA.
- Technical studies on intraday charts are bearish, Stochs and RSI have rolled over from overbought levels and are biased lower.
- We see scope for weakness. Break below 20-DMA support at 80.17 to see test of 200-DMA at 79.48.
- We evidence Doji formation on weekly charts which raises scope for downside. Violation at 200-DMA opens doors for more slumps. Scope then for test of 78 levels.
- On the flipside, we see bearish invalidation on breakout above major trendline resistance at 81.15.
Support levels - 80.17 (20-DMA), 79.48 (200-DMA), 79, 78.08 (61.8% Fib retrace of 76.09 to 81.31 rally)
Resistance levels - 80.47 (5-DMA), 81.15 (trendline), 81.31 (Jan 9 high)
FxWirePro Currency Strength Index: FxWirePro's Hourly NZD Spot Index was at -71.988 (Neutral), while Hourly JPY Spot Index was at 22.7561 (Neutral) at 0740 GMT. For more details on FxWirePro's Currency Strength Index, visit http://www.fxwirepro.com/currencyindex.
FxWirePro launches Absolute Return Managed Program. For more details, visit http://www.fxwirepro.com/invest


