


 2025 Market Outlook: Key January Events to Watch
  Trump’s "Shock and Awe" Agenda: Executive Orders from Day One
  Stock Futures Dip as Investors Await Key Payrolls Data
  Moldova Criticizes Russia Amid Transdniestria Energy Crisis
  S&P 500 Relies on Tech for Growth in Q4 2024, Says Barclays
  Lithium Market Poised for Recovery Amid Supply Cuts and Rising Demand
  Gold Prices Slide as Rate Cut Prospects Diminish; Copper Gains on China Stimulus Hopes
  Global Markets React to Strong U.S. Jobs Data and Rising Yields
  Indonesia Surprises Markets with Interest Rate Cut Amid Currency Pressure
  Mexico's Undervalued Equity Market Offers Long-Term Investment Potential


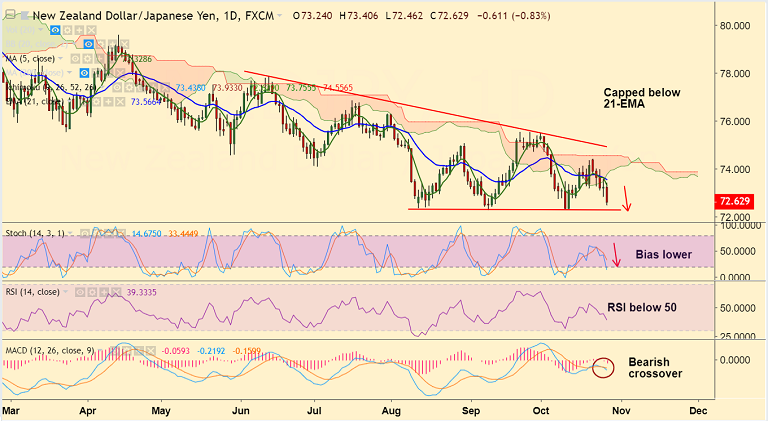
NZD/JPY chart on Trading View used for analysis
- NZD/JPY slumps 0.84% on the day to trade at 72.61 at the time of writing.
- Recovery attempts rejected below 21-EMA. Major trend for the pair is bearish.
- Risk-off flows are punishing the antipodeans across the board as traders flock into safe havens.
- We see stiff resistance at 21-EMA at 73.26. Any upside only on decisive break above. Bullish reversal only above 110-EMA.
- Technical indicators support weakness in the pair. Stochs and RSI show bearish pressures and MACD shows bearish crossover on signal line.
- Bears eye major support at 72.25 (trendline). We see weakness to accentuate on break below.
Support levels - 72.25 (trendline support), 72
Resistance levels - 73.33 (5-DMA), 73.56 (21-EMA)
Call update: Our previous call (https://www.econotimes.com/FxWirePro-NZD-JPY-finds-stiff-resistance-at-7367-good-to-go-short-on-rallies-1448904) is approaching final targets.
Recommendation: Book partial profits, stay short.
For details on FxWirePro's Currency Strength Index, visit http://www.fxwirepro.com/currencyindex.


