


 FxWirePro: USD/CNY falls to three-year high, scope for further downside
  FxWirePro- Major Pair levels and bias summary
  Ethereum Reclaims Higher Ground: Ether Bulls Target $2,700 as Middle East Tensions Thaw
  Aussie Bulls Charge: AUD/JPY Rallies as Geopolitical Clouds Part
  FxWirePro: GBP/USD stuck in range but maintains bearish bias
  FxWirePro: GBP/USD climbs to 4 -week high as ceasefire deal gives bulls traction
  FxWirePro- Major Pair levels and bias summary
  Bitcoin Breaks the $70,000 Barrier: Bulls Target the $80,000 Horizon as Geopolitical Relief Ignites Crypto Markets
  FxWirePro- Woodies Pivot(Major)
  FxWirePro- Major European Indices
  FxWirePro: AUD/USD spikes as Trump announces two-week Iran ceasefire
  Ethereum Braces for Volatility: Technicals Turn Bearish as Geopolitical Tensions Loom
  FxWirePro: USD/ZAR continues to recovers , upside pressure builds
  FxWirePro: USD/ JPY slips as yen rallies after Mideast ceasefire declaration
  FxWirePro- Major Crypto levels and bias summary
  Euro Ascendant: EUR/USD Breaks $1.17 as Geopolitical Relief Sparks a Bullish Surge


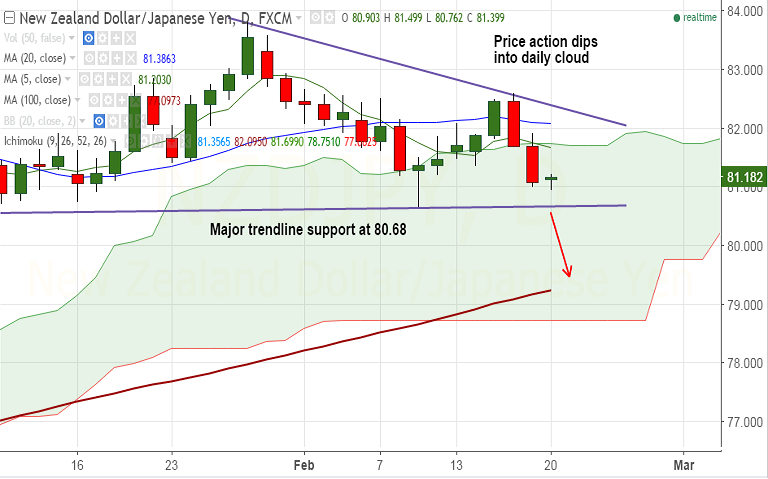
- NZD/JPY weekly charts show weakness for the pair upto weekly 20-SMA at 79.66.
- Weekly 5-DMA at 81.91 is major resistance, break above invalidates bearish bias.
- On the daily charts, the pair is trading a narrow range with Doji formation in the Asian session.
- Price action slips into daily cloud, below 20 and 5 day MAs.
- We see strong trendline support at 80.68, break below will see test of 100-DMA at 79.24.
Support levels - 80.68 (Trendline), 80, 79.66 (Weekly 20-SMA), 79.24 (100-DMA), 78.71 (cloud base)
Resistance levels - 81.66 (5-DMA), 81.76 (50-DMA), 81.91 (Weekly 5-SMA), 82 (20-DMA), 82.40 (Falling trendline)
TIME TREND INDEX OB/OS INDEX
1H Neutral Neutral
4H Neutral Neutral
1D Bearish Neutral
1W Bearish Neutral
Recommendation: Good to go short on rallies around 81.40/50, SL: 82.10, TP: 80.70/ 80/ 79.70
FxWirePro Currency Strength Index: FxWirePro's Hourly NZD Spot Index was at -83.3811(Bearish), while Hourly JPY Spot Index was at 43.981 (Neutral) at 0615 GMT. For more details on FxWirePro's Currency Strength Index, visit http://www.fxwirepro.com/currencyindex.


