


Refer NZD/CAD chart on Trading View
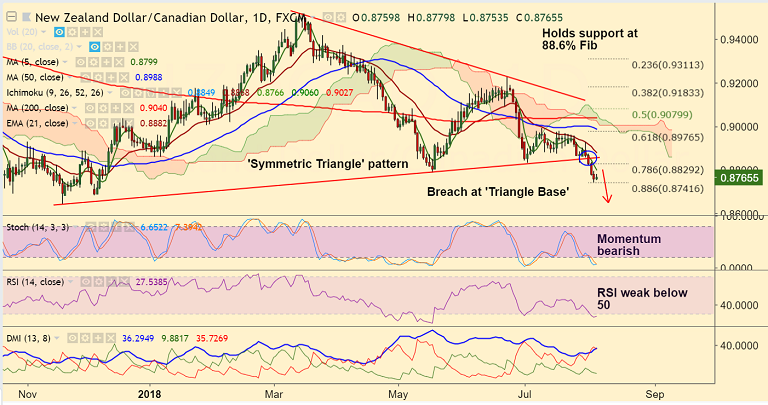
- NZD/CAD pauses downside at 88.6% Fib support at 0.8742, break below will see further weakness.
- Markets await RBNZ policy decision later this week which could offer fresh impetus for NZD.
- This RBNZ meeting is accompanied by the MPS and press conference which could provide further insight into the bank's future course.
- The Q2 inflation data did show an uplift in underlying inflation, but activity indicators remain weak. So the policymakers are likely to maintain a balanced outlook.
- Momentum with the bears. Price action has breached 'Symmetric Triangle' pattern raising scope for further weakness. Next major support lies 0.8641 (Nov 17 low).
- On the flipside, break into 'Symmetric Triangle' pattern to see some upside.
Support levels - 0.8740 (Sept 12 & Oct 19 low), 0.8689 (Oct 25 low), 0.8641 (Nov 17 low)
Resistance levels - 0.8800 (5-DMA), 0.8860 (trendline support turned resistance), 0.8882 (21-EMA)
Call update: Our previous call (https://www.econotimes.com/FxWirePro-NZD-CAD-hovers-at-Triangle-Base-decisive-break-below-to-see-dip-till-886-Fib-at-08741-1410649) has hit all targets.
Recommendation: Watch out a break below 88.6% Fib for further weakness.
FxWirePro Currency Strength Index: FxWirePro's Hourly NZD Spot Index was at -85.8665 (Bearish), while Hourly CAD Spot Index was at 99.4191 (Bullish) at 0700 GMT. For more details on FxWirePro's Currency Strength Index, visit http://www.fxwirepro.com/currencyindex.


