


 Urban studies: Doing research when every city is different
  U.S. Treasury Yields Expected to Decline Amid Cooling Economic Pressures
  Geopolitical Shocks That Could Reshape Financial Markets in 2025
  Bank of America Posts Strong Q4 2024 Results, Shares Rise
  China’s Growth Faces Structural Challenges Amid Doubts Over Data


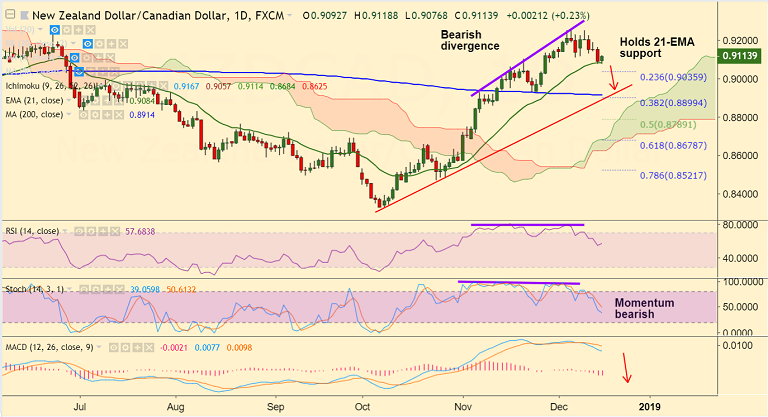
NZD/CAD chart on Trading View used for analysis
- NZD/CAD is trading 0.29% higher on the day at 0.9117 at the time of writing.
- The pair finds strong support at 21-EMA at 0.9086, break below will see weakness.
- Technical studies support downside. Stochs and RSI are biased lower.
- We evidence bearish divergence on RSI and Stochs which adds to the bearish bias.
- New Zealand Q3 GDP figures (due Wed) will drive price action if there is any significant surprise. Markets expect Q3 GDP to edge lower to 0.6% from 1.0% in the previous quarter.
- Focus also on Bank of Canada's (BoC) Consumer Price Index due Wednesday for further direction.
- Immediate support below 21-EMA lies at 23.6% Fib at 0.9035. Further weakness will see test of 200-DMA at 0.8914.
- 5-DMA at 0.9143 is immediate resistance. Decisive break above could see further upside.
Support levels - 0.9084 (21-EMA), 0.9035 (23.6% Fib), 0.90, 0.8914 (200-DMA)
Resistance levels - 0.9143 (5-DMA), 0.92, 0.9251 (Dec 11 high)
Recommendation: Watchout for break below 21-EMA to go short, target 200-DMA at 0.8914.
For details on FxWirePro's Currency Strength Index, visit http://www.fxwirepro.com/currencyindex.


